> ## Documentation Index
> Fetch the complete documentation index at: https://docs.orq.ai/llms.txt
> Use this file to discover all available pages before exploring further.
# Alerts
> Get notified when cost, latency, errors, or guardrail results cross a threshold, without watching a dashboard.
## **What Are Alerts**
**Traces** record what happened. **Alerts** report when it happened, without anyone having to look.
An **Alert** watches one metric in one **Project**, on a chosen schedule, and sends a notification the moment that metric crosses a defined threshold. A second notification follows when the metric recovers.
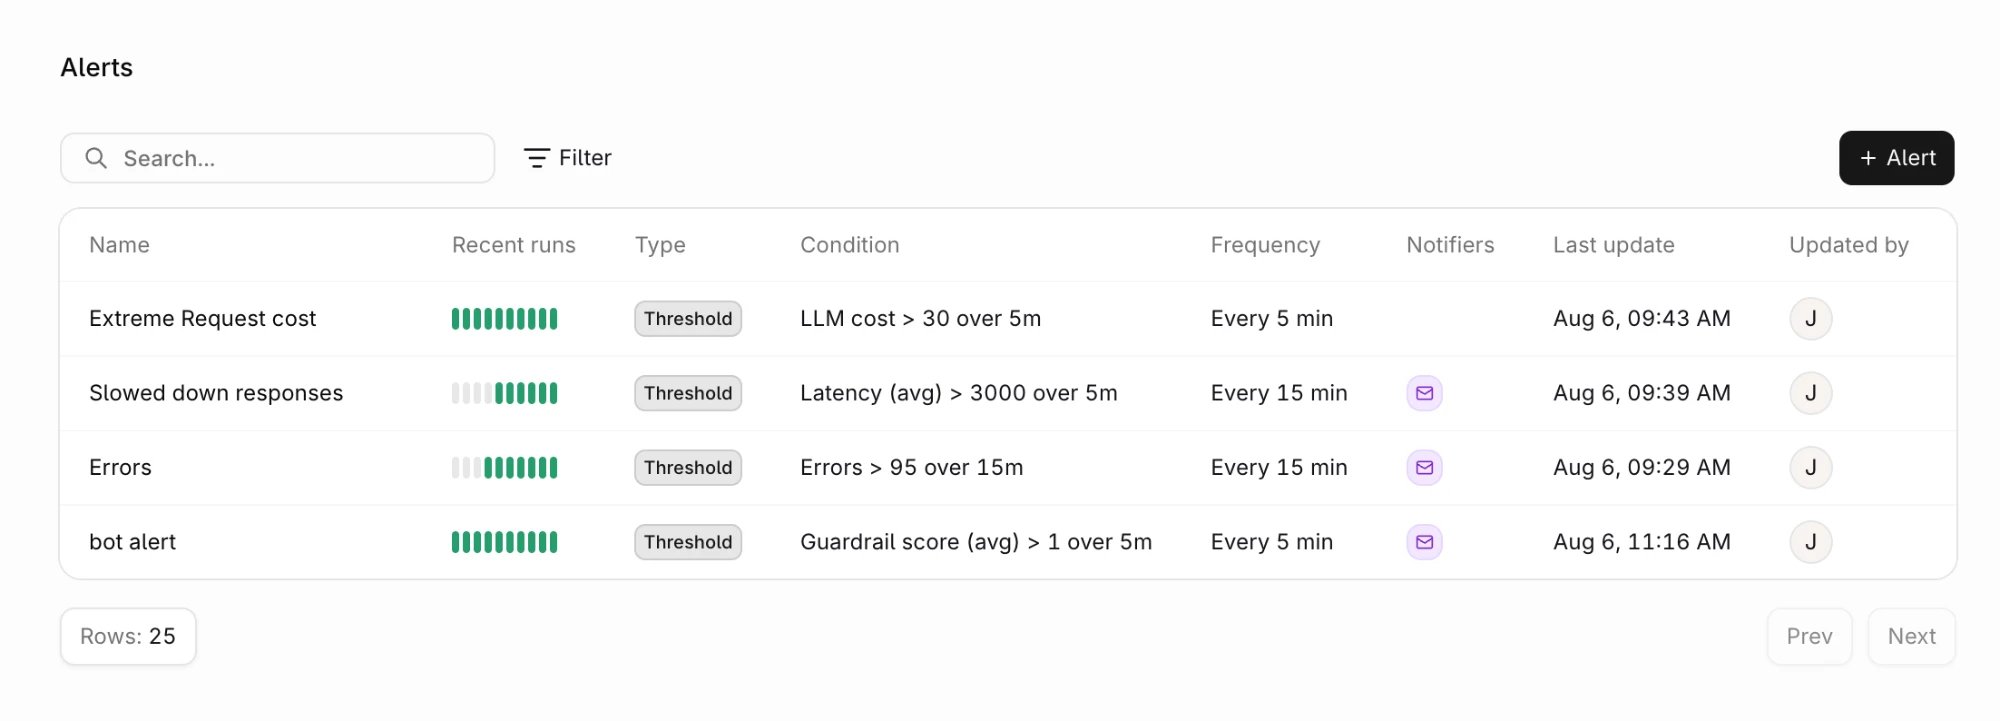 The **Recent runs** column renders each alert's evaluation history as a bar strip, showing at a glance whether it has been evaluating cleanly or breaching.
## **What Alerts Can Watch**
**Alerts** are built around four signals, each mapped to the metrics that matter for it.
Catch spend spikes before the invoice does. A runaway retry loop, a prompt
that grew, or a switch to a more expensive model surfaces within minutes.
Watch average or p95 latency. Provider degradation and slow tool calls
appear here long before they register as errors.
Watch guardrail pass rate or average guardrail score. A drop means the
model started producing output the checks reject, the earliest available
signal that quality regressed.
Watch failed request counts or error rate, scoped to a provider, model,
or **Deployment**.
Selecting a signal narrows the **Metric** dropdown to the metrics that fit it:
| Signal | Metrics |
| -------------- | ------------------------------------------------------------------------------------------------------ |
| **Cost** | `genai.cost` (LLM cost) |
| **Latency** | `genai.latency.avg` (Latency (avg)), `genai.latency.p95` (Latency p95) |
| **Errors** | `genai.errors` (Errors), `genai.error_rate` (Error rate) |
| **Guardrails** | `genai.evaluator.pass_rate` (Guardrail pass rate), `genai.evaluator.score.avg` (Guardrail score (avg)) |
## **Creating An Alert**
The **Recent runs** column renders each alert's evaluation history as a bar strip, showing at a glance whether it has been evaluating cleanly or breaching.
## **What Alerts Can Watch**
**Alerts** are built around four signals, each mapped to the metrics that matter for it.
Catch spend spikes before the invoice does. A runaway retry loop, a prompt
that grew, or a switch to a more expensive model surfaces within minutes.
Watch average or p95 latency. Provider degradation and slow tool calls
appear here long before they register as errors.
Watch guardrail pass rate or average guardrail score. A drop means the
model started producing output the checks reject, the earliest available
signal that quality regressed.
Watch failed request counts or error rate, scoped to a provider, model,
or **Deployment**.
Selecting a signal narrows the **Metric** dropdown to the metrics that fit it:
| Signal | Metrics |
| -------------- | ------------------------------------------------------------------------------------------------------ |
| **Cost** | `genai.cost` (LLM cost) |
| **Latency** | `genai.latency.avg` (Latency (avg)), `genai.latency.p95` (Latency p95) |
| **Errors** | `genai.errors` (Errors), `genai.error_rate` (Error rate) |
| **Guardrails** | `genai.evaluator.pass_rate` (Guardrail pass rate), `genai.evaluator.score.avg` (Guardrail score (avg)) |
## **Creating An Alert**
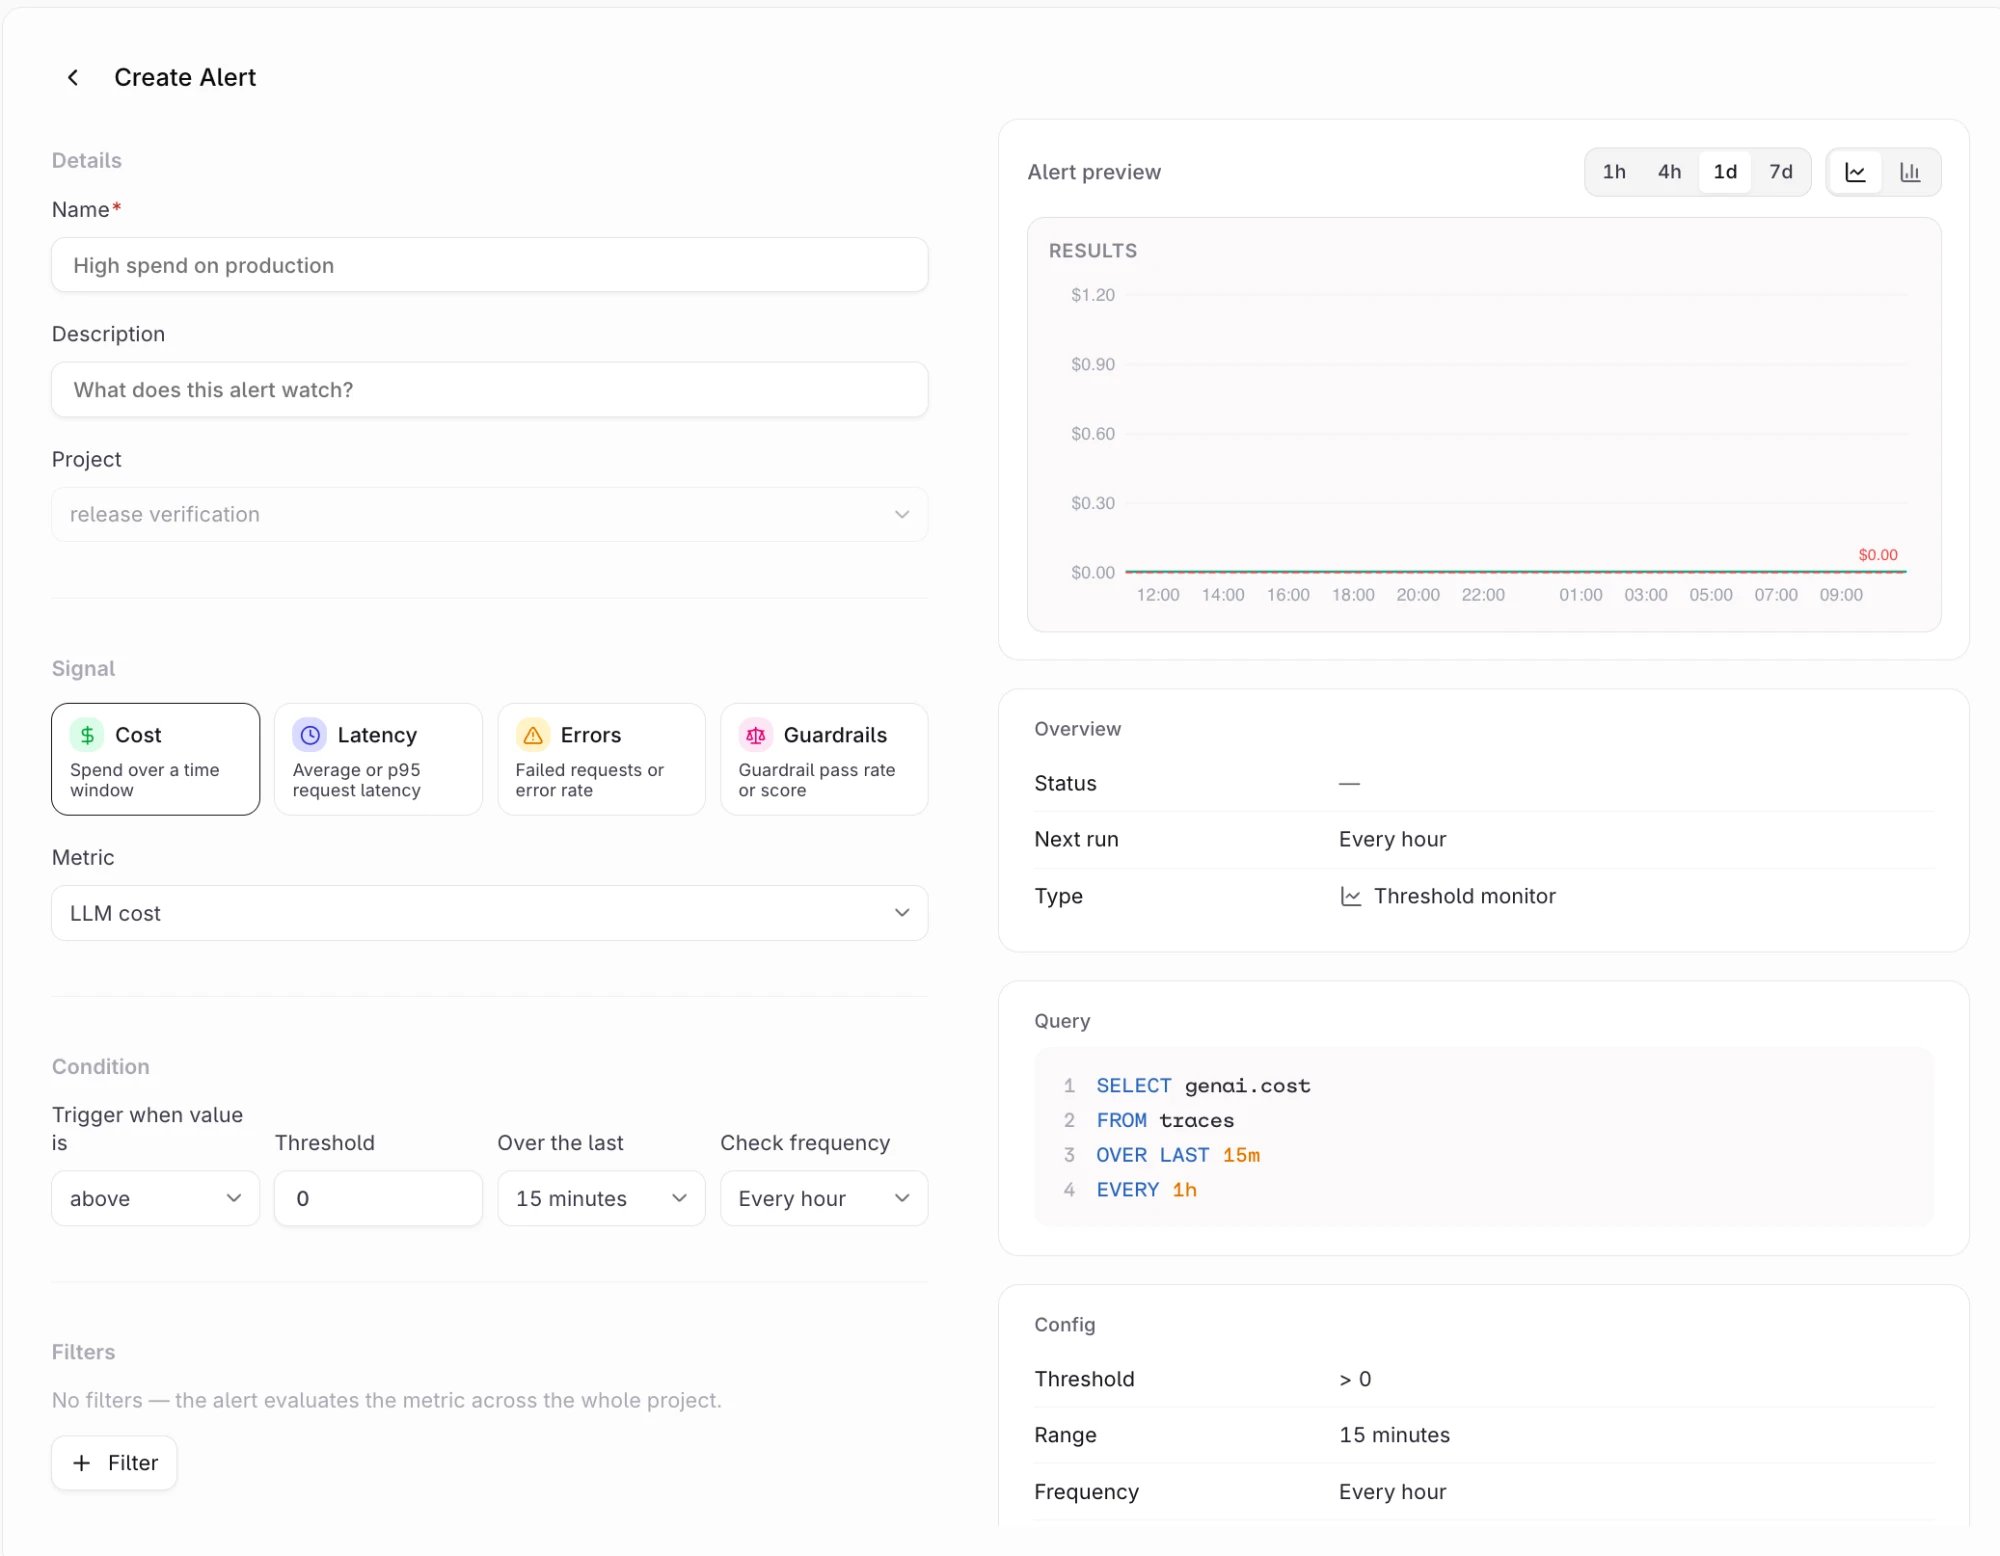 Head to **Observability** in the **AI Studio**, select the **Alerts** tab, then choose **+ Alert**.
Enter a **Name** that describes the problem rather than the metric. `High spend on production` reads better than `cost alert`. Names must be unique within the workspace.
Add an optional **Description**, and confirm the **Project**. An **Alert** belongs to exactly one **Project**, and the **Project** cannot be changed after creation.
Pick **Cost**, **Latency**, **Errors**, or **Guardrails**, then choose the **Metric**. The default is `LLM cost`.
The **Guardrails** signal adds a guardrail picker. Leaving it empty covers every guardrail in the **Project**. Selecting specific **Guardrails** limits the alert to those.
The condition reads as a single sentence: trigger when the value is **\[comparator]** **\[threshold]** over the last **\[window]**, checked **\[frequency]**.
See [Condition options](#condition-options) for the full set of values, and note that thresholds are entered in each metric's own unit.
Without filters, the **Alert** evaluates the metric across the whole **Project**. Filters restrict it to a specific slice. This step is optional. See [Filters](#filters).
Under **Notify via**, select one or more **Notifiers**, up to 10 per **Alert**. **Notifiers** are reusable destinations for email, Slack, or generic webhooks, managed under **Settings > Organization > Notifiers**. A new one can be created inline from the form.
**Notifiers** are optional. An **Alert** without any still evaluates and records its triggers, but notifies nobody.
The right-hand pane plots the metric over 1h, 4h, 1d, or 7d alongside the resolved query and stored config. Use it to check the threshold against real traffic before committing. A threshold that has never been crossed is as unhelpful as one that fires constantly.
Choose **Create Alert**. New **Alerts** are enabled immediately.
```bash cURL theme={"theme":{"light":"github-light","dark":"github-dark"}}
curl --location 'https://api.orq.ai/v2/alerts' \
--header "Authorization: Bearer $ORQ_API_KEY" \
--header 'Content-Type: application/json' \
--data-raw '{
"display_name": "High spend on production",
"description": "LLM cost above $30 in any 15 minute window",
"project_id": "01JQ8Z0MB5W1YTVN3GCK7B0EXA",
"signal": "cost",
"query": {
"metric": "genai.cost",
"filters": []
},
"condition": {
"comparator": "gt",
"threshold": 30,
"window": "15m",
"interval": "5m"
},
"notifier_ids": ["01JQ8Z1TF7QK9D2RH4NMV6PY3C"]
}'
```
```typescript TypeScript theme={"theme":{"light":"github-light","dark":"github-dark"}}
import { Orq } from "@orq-ai/node";
const orq = new Orq({ apiKey: process.env.ORQ_API_KEY ?? "" });
const alert = await orq.alerts.create({
displayName: "High spend on production",
description: "LLM cost above $30 in any 15 minute window",
projectId: "01JQ8Z0MB5W1YTVN3GCK7B0EXA",
signal: "cost",
query: { metric: "genai.cost", filters: [] },
condition: {
comparator: "gt",
threshold: 30,
window: "15m",
interval: "5m",
},
notifierIds: ["01JQ8Z1TF7QK9D2RH4NMV6PY3C"],
});
```
```python Python theme={"theme":{"light":"github-light","dark":"github-dark"}}
from orq_ai_sdk import Orq
import os
orq = Orq(api_key=os.getenv("ORQ_API_KEY"))
alert = orq.alerts.create(
display_name="High spend on production",
description="LLM cost above $30 in any 15 minute window",
project_id="01JQ8Z0MB5W1YTVN3GCK7B0EXA",
signal="cost",
query={"metric": "genai.cost", "filters": []},
condition={
"comparator": "gt",
"threshold": 30,
"window": "15m",
"interval": "5m",
},
notifier_ids=["01JQ8Z1TF7QK9D2RH4NMV6PY3C"],
)
```
The `signal` field uses different identifiers from the UI labels:
| UI label | API `signal` value |
| ------------------------------- | ------------------ |
| Cost | `cost` |
| Latency | `latency` |
| Errors | `errors` |
| Guardrails | `evals` |
| No preset, any catalogue metric | `custom` |
Alert routes are **Project** scoped, so a **Project** API key is sufficient.
The API accepts two optional `condition` fields that the form does not expose:
* `degraded_threshold`: opens a trigger at `degraded` severity before the critical threshold is reached. It must sit on the recovery side of `threshold`.
* `resolve_threshold`: hysteresis. It defaults to the lowest configured tier and must sit at or past that tier on the recovery side. Use it to stop an alert flapping when a metric hovers at the threshold.
Neither field is supported when `comparator` is `eq`.
See the [API Reference](/reference/alerts/create-an-alert) for the full parameter specification.
## **Condition Options**
| Setting | Values |
| ------------------------- | ---------------------------------------------------------------------------------------------- |
| **Trigger when value is** | `above` (`gt`), `at or above` (`gte`), `below` (`lt`), `at or below` (`lte`), `exactly` (`eq`) |
| **Over the last** | `5 minutes`, `15 minutes`, `30 minutes`, `1 hour`, `4 hours`, `1 day` |
| **Check frequency** | `Every 5 minutes`, `Every 15 minutes`, `Every hour`, `Every day` |
Thresholds are entered in each metric's own unit:
| Metric type | Unit | Example |
| --------------------- | ------------------------ | ---------------------- |
| Cost | US dollars | `30` means \$30 |
| Latency | Milliseconds | `2000` means 2 seconds |
| Pass rate, error rate | Fraction between 0 and 1 | `0.95` means 95% |
**Guardrails** and error rate are the two cases that call for a **below** comparator. A pass rate is a problem when it drops.
## **Filters**
Filters support the `is` and `is not` operators on the following fields:
**provider**, **model**, **identity**, **agent**, **deployment**, **evaluator**, **evaluator name**
Each filter group uses a single field and a single operator. An **Alert** can carry up to 20 filters.
## **Alert Lifecycle**
An **Alert** runs on its check frequency and holds one of three statuses:
| Status | Meaning |
| ----------- | ------------------------------------------------------------------------- |
| `ok` | The last evaluation did not breach the threshold |
| `degraded` | The value crossed the warning tier set by `degraded_threshold` (API only) |
| `triggered` | The value crossed the threshold |
A breach opens a **trigger**, an incident record that stays open until the metric recovers and then closes as `resolved`. Notifications fire twice per incident: once when the trigger opens, once when it resolves. No repeat-notification interval exists, so a long-running incident will not flood an inbox.
Each trigger retains its supporting evidence, including the evaluated value, the threshold it crossed, and the runs that led there, making it possible to move from a notification to the **Traces** that caused it.
## **Managing Alerts**
From the **Alerts** list:
* **Enable or disable** an **Alert**. A disabled **Alert** stops evaluating but keeps its trigger history.
* **Duplicate** an **Alert** as the starting point for a variant. Duplicates are created disabled, allowing the threshold to be adjusted before it fires.
* **Edit** any field except the **Project**.
* **Delete** an **Alert** along with its history.
Filter the list by status, enabled state, and type. Threshold alerts are currently the only type.
| Operation | Endpoint | SDK method |
| ------------------- | -------------------------------------------------------- | -------------------------- |
| Create an alert | `POST /v2/alerts` | `alerts.create` |
| List alerts | `GET /v2/alerts` | `alerts.list` |
| Retrieve an alert | `GET /v2/alerts/{alert_id}` | `alerts.get` |
| Update an alert | `PATCH /v2/alerts/{alert_id}` | `alerts.update` |
| Delete an alert | `DELETE /v2/alerts/{alert_id}` | `alerts.delete` |
| List triggers | `GET /v2/alerts/{alert_id}/triggers` | `alerts.listTriggers` |
| List trigger events | `GET /v2/alerts/{alert_id}/triggers/{trigger_id}/events` | `alerts.listTriggerEvents` |
List endpoints paginate with `limit` (1 to 200, default 25) plus the `starting_after` and `ending_before` cursors. `GET /v2/alerts` also accepts `project_id`.
```bash cURL theme={"theme":{"light":"github-light","dark":"github-dark"}}
curl --location 'https://api.orq.ai/v2/alerts/01JQ8Z2K4M6P8R0T2V4X6Z8B0D' \
--request PATCH \
--header "Authorization: Bearer $ORQ_API_KEY" \
--header 'Content-Type: application/json' \
--data-raw '{"enabled": false}'
```
```typescript TypeScript theme={"theme":{"light":"github-light","dark":"github-dark"}}
await orq.alerts.update({
alertId: "01JQ8Z2K4M6P8R0T2V4X6Z8B0D",
enabled: false,
});
```
```python Python theme={"theme":{"light":"github-light","dark":"github-dark"}}
orq.alerts.update(
alert_id="01JQ8Z2K4M6P8R0T2V4X6Z8B0D",
enabled=False,
)
```
## **Plan Limits**
The number of **Alerts** and the minimum check frequency depend on the active plan:
| Plan | Max alerts | Fastest check frequency |
| ----------------------- | ---------- | ----------------------- |
| Free, Team, Consumption | 2 | Every hour |
| Growth, Pro | 10 | Every 5 minutes |
| Custom | 20 | Every 5 minutes |
Saving an **Alert** with a frequency below the plan minimum returns `evaluation interval 5m is below your plan's minimum of 1h`.
## **Next Steps**
Investigate the requests behind a trigger.
Act on matching traces automatically instead of only notifying.
Head to **Observability** in the **AI Studio**, select the **Alerts** tab, then choose **+ Alert**.
Enter a **Name** that describes the problem rather than the metric. `High spend on production` reads better than `cost alert`. Names must be unique within the workspace.
Add an optional **Description**, and confirm the **Project**. An **Alert** belongs to exactly one **Project**, and the **Project** cannot be changed after creation.
Pick **Cost**, **Latency**, **Errors**, or **Guardrails**, then choose the **Metric**. The default is `LLM cost`.
The **Guardrails** signal adds a guardrail picker. Leaving it empty covers every guardrail in the **Project**. Selecting specific **Guardrails** limits the alert to those.
The condition reads as a single sentence: trigger when the value is **\[comparator]** **\[threshold]** over the last **\[window]**, checked **\[frequency]**.
See [Condition options](#condition-options) for the full set of values, and note that thresholds are entered in each metric's own unit.
Without filters, the **Alert** evaluates the metric across the whole **Project**. Filters restrict it to a specific slice. This step is optional. See [Filters](#filters).
Under **Notify via**, select one or more **Notifiers**, up to 10 per **Alert**. **Notifiers** are reusable destinations for email, Slack, or generic webhooks, managed under **Settings > Organization > Notifiers**. A new one can be created inline from the form.
**Notifiers** are optional. An **Alert** without any still evaluates and records its triggers, but notifies nobody.
The right-hand pane plots the metric over 1h, 4h, 1d, or 7d alongside the resolved query and stored config. Use it to check the threshold against real traffic before committing. A threshold that has never been crossed is as unhelpful as one that fires constantly.
Choose **Create Alert**. New **Alerts** are enabled immediately.
```bash cURL theme={"theme":{"light":"github-light","dark":"github-dark"}}
curl --location 'https://api.orq.ai/v2/alerts' \
--header "Authorization: Bearer $ORQ_API_KEY" \
--header 'Content-Type: application/json' \
--data-raw '{
"display_name": "High spend on production",
"description": "LLM cost above $30 in any 15 minute window",
"project_id": "01JQ8Z0MB5W1YTVN3GCK7B0EXA",
"signal": "cost",
"query": {
"metric": "genai.cost",
"filters": []
},
"condition": {
"comparator": "gt",
"threshold": 30,
"window": "15m",
"interval": "5m"
},
"notifier_ids": ["01JQ8Z1TF7QK9D2RH4NMV6PY3C"]
}'
```
```typescript TypeScript theme={"theme":{"light":"github-light","dark":"github-dark"}}
import { Orq } from "@orq-ai/node";
const orq = new Orq({ apiKey: process.env.ORQ_API_KEY ?? "" });
const alert = await orq.alerts.create({
displayName: "High spend on production",
description: "LLM cost above $30 in any 15 minute window",
projectId: "01JQ8Z0MB5W1YTVN3GCK7B0EXA",
signal: "cost",
query: { metric: "genai.cost", filters: [] },
condition: {
comparator: "gt",
threshold: 30,
window: "15m",
interval: "5m",
},
notifierIds: ["01JQ8Z1TF7QK9D2RH4NMV6PY3C"],
});
```
```python Python theme={"theme":{"light":"github-light","dark":"github-dark"}}
from orq_ai_sdk import Orq
import os
orq = Orq(api_key=os.getenv("ORQ_API_KEY"))
alert = orq.alerts.create(
display_name="High spend on production",
description="LLM cost above $30 in any 15 minute window",
project_id="01JQ8Z0MB5W1YTVN3GCK7B0EXA",
signal="cost",
query={"metric": "genai.cost", "filters": []},
condition={
"comparator": "gt",
"threshold": 30,
"window": "15m",
"interval": "5m",
},
notifier_ids=["01JQ8Z1TF7QK9D2RH4NMV6PY3C"],
)
```
The `signal` field uses different identifiers from the UI labels:
| UI label | API `signal` value |
| ------------------------------- | ------------------ |
| Cost | `cost` |
| Latency | `latency` |
| Errors | `errors` |
| Guardrails | `evals` |
| No preset, any catalogue metric | `custom` |
Alert routes are **Project** scoped, so a **Project** API key is sufficient.
The API accepts two optional `condition` fields that the form does not expose:
* `degraded_threshold`: opens a trigger at `degraded` severity before the critical threshold is reached. It must sit on the recovery side of `threshold`.
* `resolve_threshold`: hysteresis. It defaults to the lowest configured tier and must sit at or past that tier on the recovery side. Use it to stop an alert flapping when a metric hovers at the threshold.
Neither field is supported when `comparator` is `eq`.
See the [API Reference](/reference/alerts/create-an-alert) for the full parameter specification.
## **Condition Options**
| Setting | Values |
| ------------------------- | ---------------------------------------------------------------------------------------------- |
| **Trigger when value is** | `above` (`gt`), `at or above` (`gte`), `below` (`lt`), `at or below` (`lte`), `exactly` (`eq`) |
| **Over the last** | `5 minutes`, `15 minutes`, `30 minutes`, `1 hour`, `4 hours`, `1 day` |
| **Check frequency** | `Every 5 minutes`, `Every 15 minutes`, `Every hour`, `Every day` |
Thresholds are entered in each metric's own unit:
| Metric type | Unit | Example |
| --------------------- | ------------------------ | ---------------------- |
| Cost | US dollars | `30` means \$30 |
| Latency | Milliseconds | `2000` means 2 seconds |
| Pass rate, error rate | Fraction between 0 and 1 | `0.95` means 95% |
**Guardrails** and error rate are the two cases that call for a **below** comparator. A pass rate is a problem when it drops.
## **Filters**
Filters support the `is` and `is not` operators on the following fields:
**provider**, **model**, **identity**, **agent**, **deployment**, **evaluator**, **evaluator name**
Each filter group uses a single field and a single operator. An **Alert** can carry up to 20 filters.
## **Alert Lifecycle**
An **Alert** runs on its check frequency and holds one of three statuses:
| Status | Meaning |
| ----------- | ------------------------------------------------------------------------- |
| `ok` | The last evaluation did not breach the threshold |
| `degraded` | The value crossed the warning tier set by `degraded_threshold` (API only) |
| `triggered` | The value crossed the threshold |
A breach opens a **trigger**, an incident record that stays open until the metric recovers and then closes as `resolved`. Notifications fire twice per incident: once when the trigger opens, once when it resolves. No repeat-notification interval exists, so a long-running incident will not flood an inbox.
Each trigger retains its supporting evidence, including the evaluated value, the threshold it crossed, and the runs that led there, making it possible to move from a notification to the **Traces** that caused it.
## **Managing Alerts**
From the **Alerts** list:
* **Enable or disable** an **Alert**. A disabled **Alert** stops evaluating but keeps its trigger history.
* **Duplicate** an **Alert** as the starting point for a variant. Duplicates are created disabled, allowing the threshold to be adjusted before it fires.
* **Edit** any field except the **Project**.
* **Delete** an **Alert** along with its history.
Filter the list by status, enabled state, and type. Threshold alerts are currently the only type.
| Operation | Endpoint | SDK method |
| ------------------- | -------------------------------------------------------- | -------------------------- |
| Create an alert | `POST /v2/alerts` | `alerts.create` |
| List alerts | `GET /v2/alerts` | `alerts.list` |
| Retrieve an alert | `GET /v2/alerts/{alert_id}` | `alerts.get` |
| Update an alert | `PATCH /v2/alerts/{alert_id}` | `alerts.update` |
| Delete an alert | `DELETE /v2/alerts/{alert_id}` | `alerts.delete` |
| List triggers | `GET /v2/alerts/{alert_id}/triggers` | `alerts.listTriggers` |
| List trigger events | `GET /v2/alerts/{alert_id}/triggers/{trigger_id}/events` | `alerts.listTriggerEvents` |
List endpoints paginate with `limit` (1 to 200, default 25) plus the `starting_after` and `ending_before` cursors. `GET /v2/alerts` also accepts `project_id`.
```bash cURL theme={"theme":{"light":"github-light","dark":"github-dark"}}
curl --location 'https://api.orq.ai/v2/alerts/01JQ8Z2K4M6P8R0T2V4X6Z8B0D' \
--request PATCH \
--header "Authorization: Bearer $ORQ_API_KEY" \
--header 'Content-Type: application/json' \
--data-raw '{"enabled": false}'
```
```typescript TypeScript theme={"theme":{"light":"github-light","dark":"github-dark"}}
await orq.alerts.update({
alertId: "01JQ8Z2K4M6P8R0T2V4X6Z8B0D",
enabled: false,
});
```
```python Python theme={"theme":{"light":"github-light","dark":"github-dark"}}
orq.alerts.update(
alert_id="01JQ8Z2K4M6P8R0T2V4X6Z8B0D",
enabled=False,
)
```
## **Plan Limits**
The number of **Alerts** and the minimum check frequency depend on the active plan:
| Plan | Max alerts | Fastest check frequency |
| ----------------------- | ---------- | ----------------------- |
| Free, Team, Consumption | 2 | Every hour |
| Growth, Pro | 10 | Every 5 minutes |
| Custom | 20 | Every 5 minutes |
Saving an **Alert** with a frequency below the plan minimum returns `evaluation interval 5m is below your plan's minimum of 1h`.
## **Next Steps**
Investigate the requests behind a trigger.
Act on matching traces automatically instead of only notifying.