> ## Documentation Index
> Fetch the complete documentation index at: https://docs.orq.ai/llms.txt
> Use this file to discover all available pages before exploring further.
# Control Tower assets
> View and manage all AI assets in your workspace from a single page. Browse agents, tools, deployments, and models with usage and cost summaries.
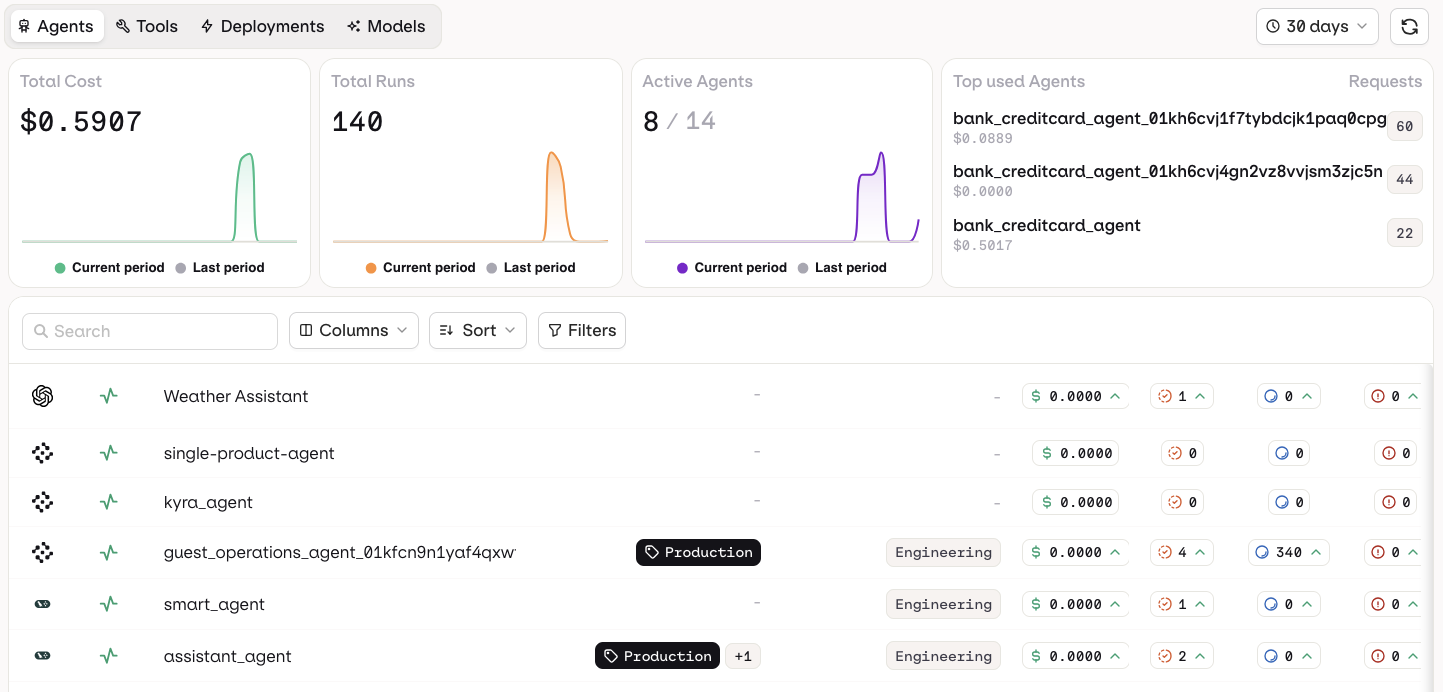
The Assets page gives you a unified view of all AI assets in your workspace, organized across four tabs: **Agents**, **Tools**, **Deployments**, and **Models**. The summary cards at the top vary per tab, while the table columns and controls are shared across all tabs.
 ## Asset Tabs
Use the tabs at the top to switch between asset types:
* **[Agents](/docs/ai-studio/ai-engineering/build-agents)**: AI agents built or connected in your workspace
* **[Tools](/docs/ai-studio/ai-engineering/create-tools)**: Tools available to your agents
* **[Deployments](/docs/deployments/overview)**: Deployed configurations of your agents
* **[Models](/docs/ai-studio/ai-gateway/add-models)**: LLM models in use across your assets
## Summary Cards
Each tab displays four summary cards at the top. All cards include a sparkline overlaying the **current period** against the **last period**.
* **Total Cost**: Total spend for all agents in the selected period
* **Total Runs**: Total number of agent invocations
* **Active Agents**: Number of active agents out of the total (e.g. 0 / 7)
* **Top used Agents**: Ranked list of the most-invoked agents, with cost and request count
* **Total Cost**: Total spend for all tools in the selected period
* **Total Runs**: Total number of tool invocations
* **Active Tools**: Number of active tools out of the total (e.g. 22 / 25)
* **Top Tools Usage**: Ranked list of the most-used tools, with cost and run count
* **Total Cost**: Total spend for all deployments in the selected period
* **Total Runs**: Total number of deployment invocations
* **Error rate**: Percentage of requests that resulted in an error
* **Top used Deployments**: Ranked list of the most-invoked deployments, with cost and token usage
* **Total Cost**: Total spend across all models in the selected period
* **Total Runs**: Total number of model invocations
* **Error rate**: Percentage of requests that resulted in an error
* **Top used Models**: Ranked list of the most-used models, with cost and average tokens per request
## Asset Table
### Columns
| Column | Description |
| --------------------------------------------------------------------------------------------------------------------------------- | ----------------------------------------------------------------------------------------------------------------- |
| **Source** | Whether the asset originates from Orq.ai or a [third-party integration](#asset-capture-via-third-party-framework) |
| **[Status](#status-icons)** | Whether the asset is active, idle, or zombie. See Status Icons below. |
| **Name** | The asset name |
| **Tags** | Customer-defined tags. Multiple tags can be applied per asset |
| **Department** | The department the asset is assigned to |
| **Cost** | Total cost incurred by the asset in the selected period |
| **Runs** | Number of times the asset was invoked |
| **Tokens** | Total tokens consumed |
| **Errors** | Number of errors recorded |
| **[Trust](#trust-levels)** | The trust level assigned to the asset. See Trust Levels below. |
| **Last Active** | Time elapsed since the asset was last invoked |
### Status Icons
Each asset name is prefixed with a status icon indicating its activity level:
| Status | Description |
| ------------------------------------------------------------------------------------------------------------------------- | -------------------------------------------------------- |
| **Active** | The asset has been invoked in the last 14 days |
| **Idle** | The asset has not been invoked in the last 14 to 30 days |
| **Zombie** | The asset has not been invoked in more than 30 days |
### Trust Levels
Each asset can be assigned a trust level to communicate its production readiness to your team. To set it, click anywhere on an asset row to open the detail panel, then use the **Trust level** dropdown.
| Trust Level | Description |
| ----------------------------------------------------------------------------------------------------------------------------------------- | ------------------------------------------------------------ |
| **Endorsed** | The asset has been reviewed and approved for use |
| **Not Endorsed** | The asset has not been reviewed or approved |
| **Deprecated** | The asset has been marked for removal and should not be used |
### Tags
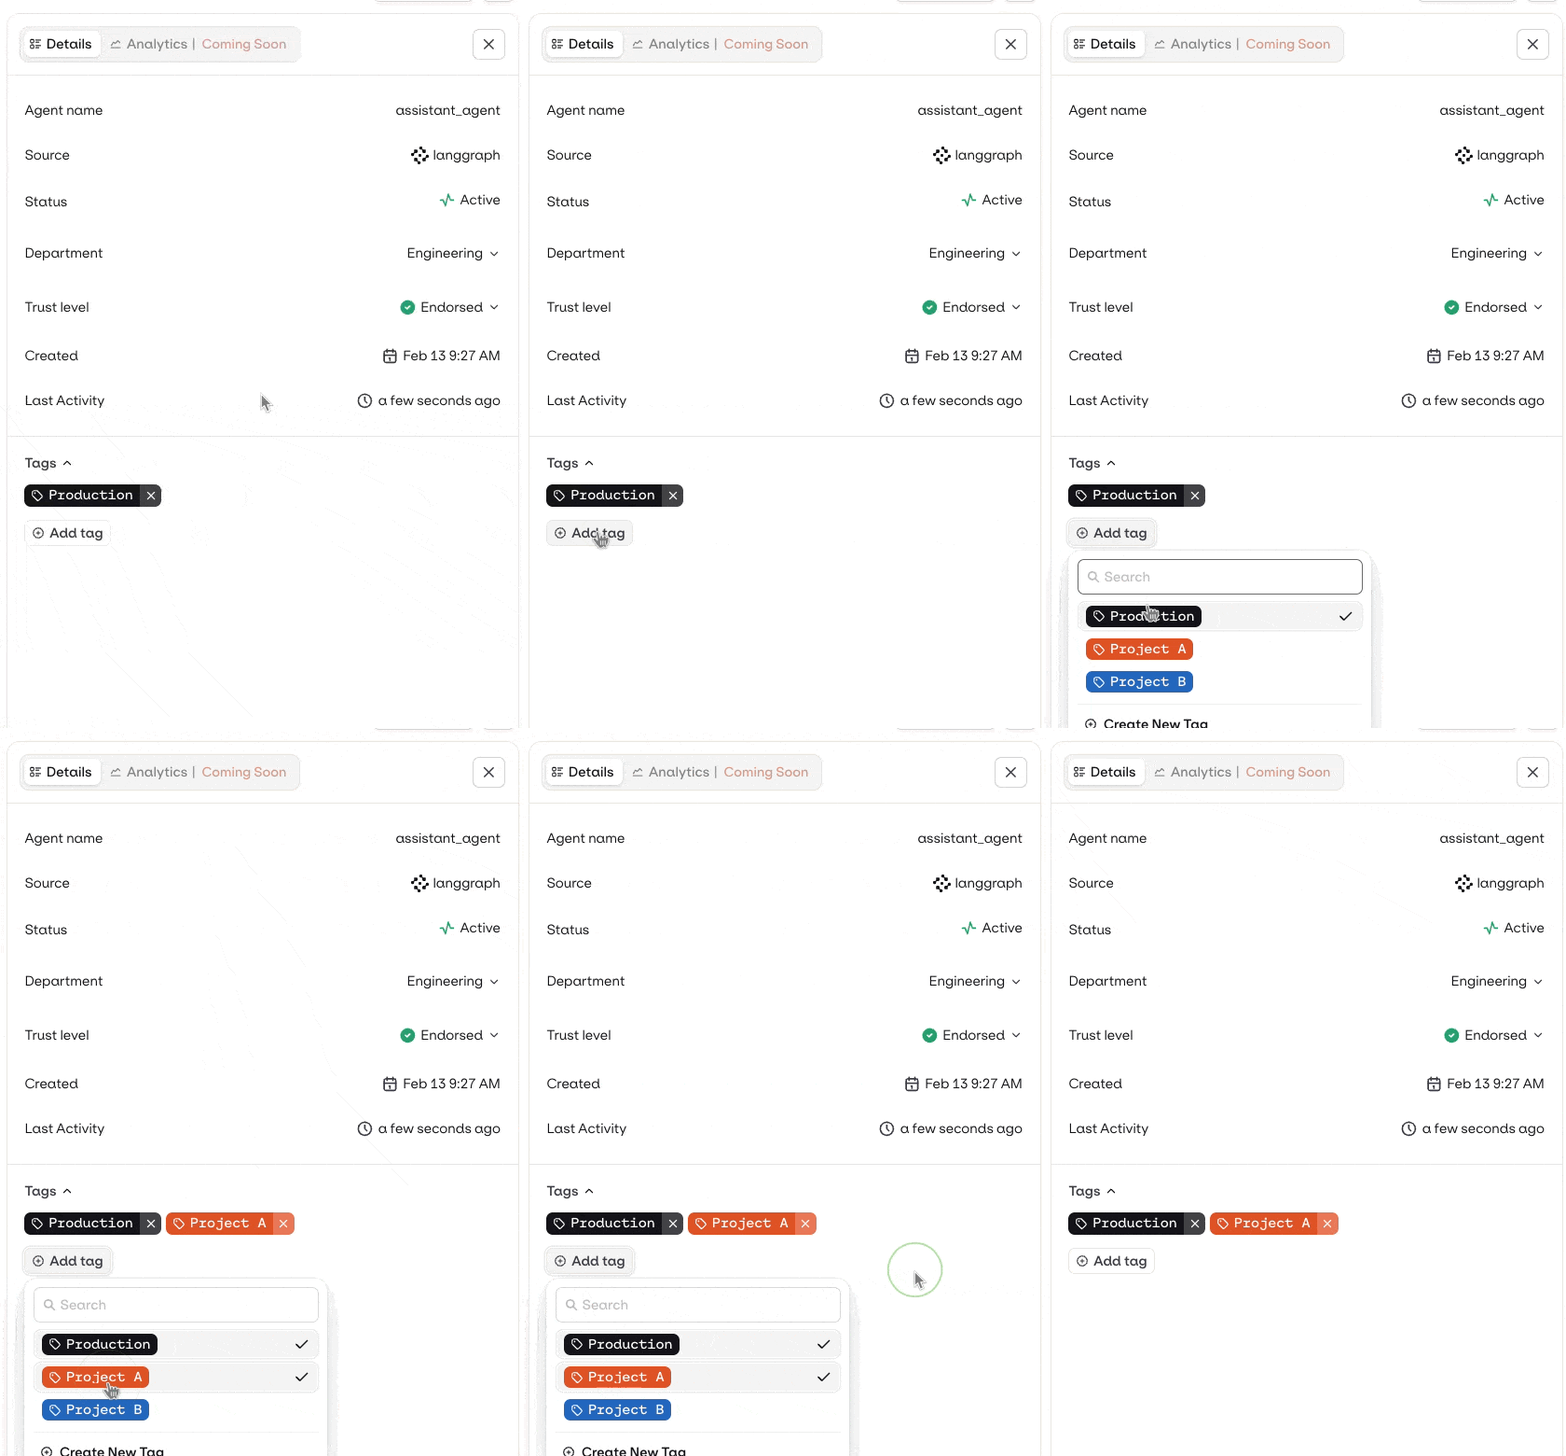
Tags are set manually per asset via the Asset Detail Panel. They are also visible in the [Overview](/docs/control-tower/overview) table and can be used for filtering.
Click anywhere on an asset row to open the detail panel. In the **Details** tab, scroll to the **Tags** section. Click **Add tag** to add a new tag, or click **×** on an existing tag to remove it.
## Asset Tabs
Use the tabs at the top to switch between asset types:
* **[Agents](/docs/ai-studio/ai-engineering/build-agents)**: AI agents built or connected in your workspace
* **[Tools](/docs/ai-studio/ai-engineering/create-tools)**: Tools available to your agents
* **[Deployments](/docs/deployments/overview)**: Deployed configurations of your agents
* **[Models](/docs/ai-studio/ai-gateway/add-models)**: LLM models in use across your assets
## Summary Cards
Each tab displays four summary cards at the top. All cards include a sparkline overlaying the **current period** against the **last period**.
* **Total Cost**: Total spend for all agents in the selected period
* **Total Runs**: Total number of agent invocations
* **Active Agents**: Number of active agents out of the total (e.g. 0 / 7)
* **Top used Agents**: Ranked list of the most-invoked agents, with cost and request count
* **Total Cost**: Total spend for all tools in the selected period
* **Total Runs**: Total number of tool invocations
* **Active Tools**: Number of active tools out of the total (e.g. 22 / 25)
* **Top Tools Usage**: Ranked list of the most-used tools, with cost and run count
* **Total Cost**: Total spend for all deployments in the selected period
* **Total Runs**: Total number of deployment invocations
* **Error rate**: Percentage of requests that resulted in an error
* **Top used Deployments**: Ranked list of the most-invoked deployments, with cost and token usage
* **Total Cost**: Total spend across all models in the selected period
* **Total Runs**: Total number of model invocations
* **Error rate**: Percentage of requests that resulted in an error
* **Top used Models**: Ranked list of the most-used models, with cost and average tokens per request
## Asset Table
### Columns
| Column | Description |
| --------------------------------------------------------------------------------------------------------------------------------- | ----------------------------------------------------------------------------------------------------------------- |
| **Source** | Whether the asset originates from Orq.ai or a [third-party integration](#asset-capture-via-third-party-framework) |
| **[Status](#status-icons)** | Whether the asset is active, idle, or zombie. See Status Icons below. |
| **Name** | The asset name |
| **Tags** | Customer-defined tags. Multiple tags can be applied per asset |
| **Department** | The department the asset is assigned to |
| **Cost** | Total cost incurred by the asset in the selected period |
| **Runs** | Number of times the asset was invoked |
| **Tokens** | Total tokens consumed |
| **Errors** | Number of errors recorded |
| **[Trust](#trust-levels)** | The trust level assigned to the asset. See Trust Levels below. |
| **Last Active** | Time elapsed since the asset was last invoked |
### Status Icons
Each asset name is prefixed with a status icon indicating its activity level:
| Status | Description |
| ------------------------------------------------------------------------------------------------------------------------- | -------------------------------------------------------- |
| **Active** | The asset has been invoked in the last 14 days |
| **Idle** | The asset has not been invoked in the last 14 to 30 days |
| **Zombie** | The asset has not been invoked in more than 30 days |
### Trust Levels
Each asset can be assigned a trust level to communicate its production readiness to your team. To set it, click anywhere on an asset row to open the detail panel, then use the **Trust level** dropdown.
| Trust Level | Description |
| ----------------------------------------------------------------------------------------------------------------------------------------- | ------------------------------------------------------------ |
| **Endorsed** | The asset has been reviewed and approved for use |
| **Not Endorsed** | The asset has not been reviewed or approved |
| **Deprecated** | The asset has been marked for removal and should not be used |
### Tags
Tags are set manually per asset via the Asset Detail Panel. They are also visible in the [Overview](/docs/control-tower/overview) table and can be used for filtering.
Click anywhere on an asset row to open the detail panel. In the **Details** tab, scroll to the **Tags** section. Click **Add tag** to add a new tag, or click **×** on an existing tag to remove it.
 ### Department
A dedicated department dropdown is available at the top of the Asset Detail Panel. Click anywhere on an asset row to open it, then select a department directly from the dropdown.
### Table Controls
#### Column Selector
Click **Columns** to show or hide specific columns. This lets you focus on the metrics most relevant to your workflow.
#### Sorting
Click **Sort** to sort the table by any column, ascending or descending.
#### Filters
Click **Filters** to narrow the asset list. You can filter by tags, department, status, and other attributes.
## Asset Detail Panel
Click any asset row to open its detail panel. It contains two tabs:
* **Details**: Shows source, status, model, owner, creation date, last activity, tags, and department. Tags and department can be edited directly from this panel.
* **Overview**: Shows performance metrics for the selected asset
## Asset Capture via Third-Party Framework
Assets in Control Tower can be populated automatically when you instrument your code with OpenTelemetry and send traces to Orq.ai. Each trace carries information about which agents, tools, and models were invoked. Orq.ai extracts these and registers them as assets without any manual configuration.
Orq.ai currently supports asset capture from **OpenAI Agents**, **LangGraph**, and **Vercel AI SDK** traces. See the framework documentation for setup instructions and examples:
Instrument OpenAI Agents with `OpenAIAgentsInstrumentor` and send traces to Orq.ai for automatic asset registration.
Instrument LangGraph agents with `setup()` from `orq_ai_sdk.langchain` to capture traces and automatically register assets in Control Tower.
Use `experimental_telemetry` with the Vercel AI SDK to capture agents, tools, and models in Control Tower.
### Department
A dedicated department dropdown is available at the top of the Asset Detail Panel. Click anywhere on an asset row to open it, then select a department directly from the dropdown.
### Table Controls
#### Column Selector
Click **Columns** to show or hide specific columns. This lets you focus on the metrics most relevant to your workflow.
#### Sorting
Click **Sort** to sort the table by any column, ascending or descending.
#### Filters
Click **Filters** to narrow the asset list. You can filter by tags, department, status, and other attributes.
## Asset Detail Panel
Click any asset row to open its detail panel. It contains two tabs:
* **Details**: Shows source, status, model, owner, creation date, last activity, tags, and department. Tags and department can be edited directly from this panel.
* **Overview**: Shows performance metrics for the selected asset
## Asset Capture via Third-Party Framework
Assets in Control Tower can be populated automatically when you instrument your code with OpenTelemetry and send traces to Orq.ai. Each trace carries information about which agents, tools, and models were invoked. Orq.ai extracts these and registers them as assets without any manual configuration.
Orq.ai currently supports asset capture from **OpenAI Agents**, **LangGraph**, and **Vercel AI SDK** traces. See the framework documentation for setup instructions and examples:
Instrument OpenAI Agents with `OpenAIAgentsInstrumentor` and send traces to Orq.ai for automatic asset registration.
Instrument LangGraph agents with `setup()` from `orq_ai_sdk.langchain` to capture traces and automatically register assets in Control Tower.
Use `experimental_telemetry` with the Vercel AI SDK to capture agents, tools, and models in Control Tower.