> ## Documentation Index
> Fetch the complete documentation index at: https://docs.orq.ai/llms.txt
> Use this file to discover all available pages before exploring further.
# Control Tower
> Monitor all AI agents in real time with a live dashboard. Track costs, token usage, error rates, and performance across your workspace.
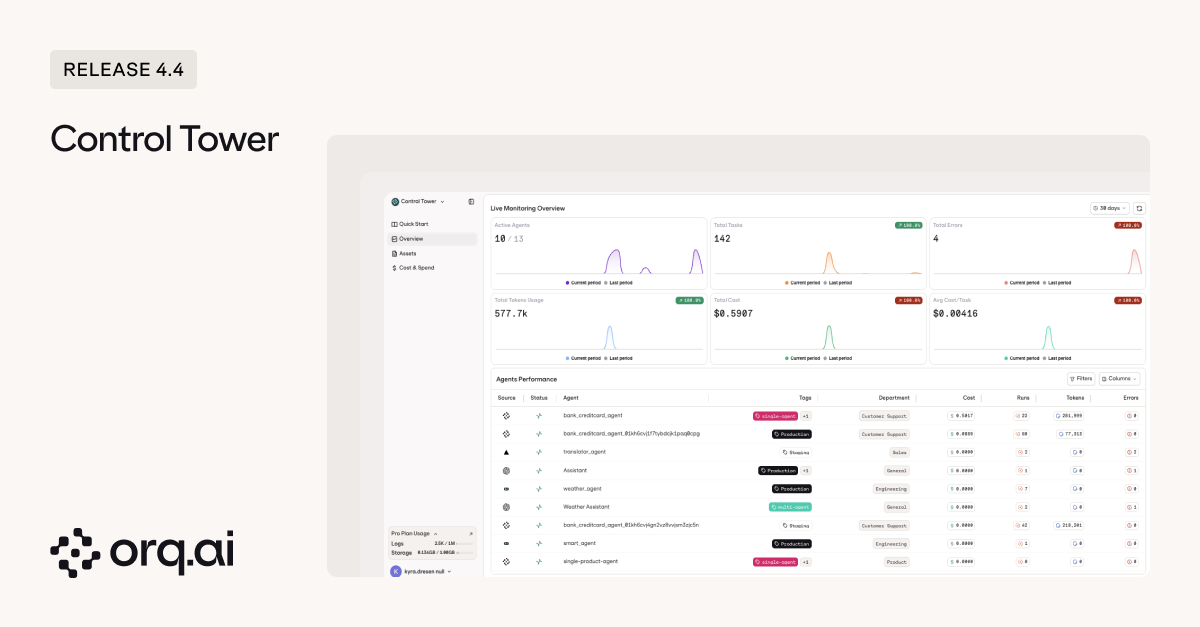
The Control Tower Overview provides a live monitoring dashboard across all agents in your workspace. Use it to track spending, performance, and usage at a glance.
 ## Summary Metrics
Six metric cards are displayed at the top of the page. Each card includes a sparkline chart overlaying the **current period** against the **last period**, giving you an immediate visual sense of whether a metric is trending up or down.
| Metric | Description |
| ---------------------- | --------------------------------------------------------------- |
| **Active Agents** | Number of currently active agents out of your total agent count |
| **Total Tasks** | Total number of tasks executed across all agents |
| **Total Errors** | Number of errors and the corresponding error rate |
| **Total Tokens Usage** | Total number of tokens consumed across all model calls |
| **Total Cost** | Total spend across all agents in the selected period |
| **Avg Cost / Task** | Average cost per task, useful for benchmarking efficiency |
## Agents Performance Table
The table below the summary cards lists all [agents](/docs/ai-studio/ai-engineering/build-agents) and their performance metrics for the selected period.
### Columns
| Column | Description |
| ------------------------------------------------------------------------------------------------------------------------- | -------------------------------------------------------------------------------------------------------------- |
| **Source** | Whether the agent originates from Orq.ai or a third-party integration |
| **[Status](#agent-status-icons)** | Shows whether the agent is active, idle, or zombie. Use this to identify agents that are no longer being used. |
| **Name** | The agent name |
| **Tags** | Customer-defined tags assigned to the agent. |
| **Department** | The department the agent is assigned to |
| **Cost** | Total cost incurred by the agent in the selected period |
| **Runs** | Number of times the agent was invoked |
| **Tokens** | Total tokens consumed by the agent |
### Agent Status Icons
Each agent name is prefixed with a status icon:
| Status | Description |
| ------------------------------------------------------------------------------------------------------------------------- | -------------------------------------------------------- |
| **Active** | The agent has been invoked in the last 14 days |
| **Idle** | The agent has not been invoked in the last 14 to 30 days |
| **Zombie** | The agent has not been invoked in more than 30 days |
### Tags and Department
Tags and department are displayed here but can only be edited from the [Assets page](/docs/control-tower/assets#tags).
## Table Controls
* **Filters**: Filter the agent list by tags, department, status, or other attributes
* **Columns**: Show or hide specific columns to focus on the metrics that matter to you
## Filters
Use the time filter in the top-right corner to set the monitoring period. All summary metrics and the agent table update to reflect the selected range. The comparison is always made against the equivalent previous period. For example, selecting **30 days** compares the current 30-day window against the prior 30 days.
You can also filter by **[Project](/docs/ai-studio/get-started/projects)** to scope the data to a specific project within your workspace.
Project filtering currently applies only to Orq.ai-native agents and assets. Third-party framework integrations are not scoped by project.
## Summary Metrics
Six metric cards are displayed at the top of the page. Each card includes a sparkline chart overlaying the **current period** against the **last period**, giving you an immediate visual sense of whether a metric is trending up or down.
| Metric | Description |
| ---------------------- | --------------------------------------------------------------- |
| **Active Agents** | Number of currently active agents out of your total agent count |
| **Total Tasks** | Total number of tasks executed across all agents |
| **Total Errors** | Number of errors and the corresponding error rate |
| **Total Tokens Usage** | Total number of tokens consumed across all model calls |
| **Total Cost** | Total spend across all agents in the selected period |
| **Avg Cost / Task** | Average cost per task, useful for benchmarking efficiency |
## Agents Performance Table
The table below the summary cards lists all [agents](/docs/ai-studio/ai-engineering/build-agents) and their performance metrics for the selected period.
### Columns
| Column | Description |
| ------------------------------------------------------------------------------------------------------------------------- | -------------------------------------------------------------------------------------------------------------- |
| **Source** | Whether the agent originates from Orq.ai or a third-party integration |
| **[Status](#agent-status-icons)** | Shows whether the agent is active, idle, or zombie. Use this to identify agents that are no longer being used. |
| **Name** | The agent name |
| **Tags** | Customer-defined tags assigned to the agent. |
| **Department** | The department the agent is assigned to |
| **Cost** | Total cost incurred by the agent in the selected period |
| **Runs** | Number of times the agent was invoked |
| **Tokens** | Total tokens consumed by the agent |
### Agent Status Icons
Each agent name is prefixed with a status icon:
| Status | Description |
| ------------------------------------------------------------------------------------------------------------------------- | -------------------------------------------------------- |
| **Active** | The agent has been invoked in the last 14 days |
| **Idle** | The agent has not been invoked in the last 14 to 30 days |
| **Zombie** | The agent has not been invoked in more than 30 days |
### Tags and Department
Tags and department are displayed here but can only be edited from the [Assets page](/docs/control-tower/assets#tags).
## Table Controls
* **Filters**: Filter the agent list by tags, department, status, or other attributes
* **Columns**: Show or hide specific columns to focus on the metrics that matter to you
## Filters
Use the time filter in the top-right corner to set the monitoring period. All summary metrics and the agent table update to reflect the selected range. The comparison is always made against the equivalent previous period. For example, selecting **30 days** compares the current 30-day window against the prior 30 days.
You can also filter by **[Project](/docs/ai-studio/get-started/projects)** to scope the data to a specific project within your workspace.
Project filtering currently applies only to Orq.ai-native agents and assets. Third-party framework integrations are not scoped by project.