

Added support for Google’s latest Gemini 3 Pro Preview model with advanced reasoning capabilities and configurable thinking levels.Key Features:
- Advanced reasoning with configurable thinking levels (low/high) for complex problem-solving tasks
- 1M+ context window (1,048,576 tokens) for processing large documents and extended conversations
- Vision capabilities supporting both text and image inputs
- Tool calling support with JSON schema response format validation
Explore Gemini 3 Pro Preview in the AI Router and leverage its advanced reasoning capabilities for your most complex use cases.
Claude models now support JSON schema validation through Anthropic’s Structured Outputs beta API, ensuring your AI responses conform to predefined schemas with guaranteed type safety.What’s included:
- JSON Schema Validation for Claude Sonnet 4.5 and Claude Opus 4.1, enabling strict adherence to your defined output structure
- Type-safe responses that match your schema requirements, reducing parsing errors and validation overhead
-
Seamless integration across Deployments, Experiments, and the AI Gateway using the
json_schemaresponse format typeLearn more about Claude Structured Outputs including JSON schema limitations and best practices.
Added support for OpenAI’s latest GPT-5.1 models to the AI Router.Available Models
- gpt-5.1 - The best model for coding and agentic tasks with configurable reasoning effort. Features a 400k context window and advanced capabilities for tool calling and structured outputs.
- gpt-5.1-chat-latest - GPT-5.1 snapshot currently used in ChatGPT with 128k context window. Supports vision capabilities and streaming.
Explore these new models in the AI Router and use them in Deployments, Experiments, or via the AI Gateway.
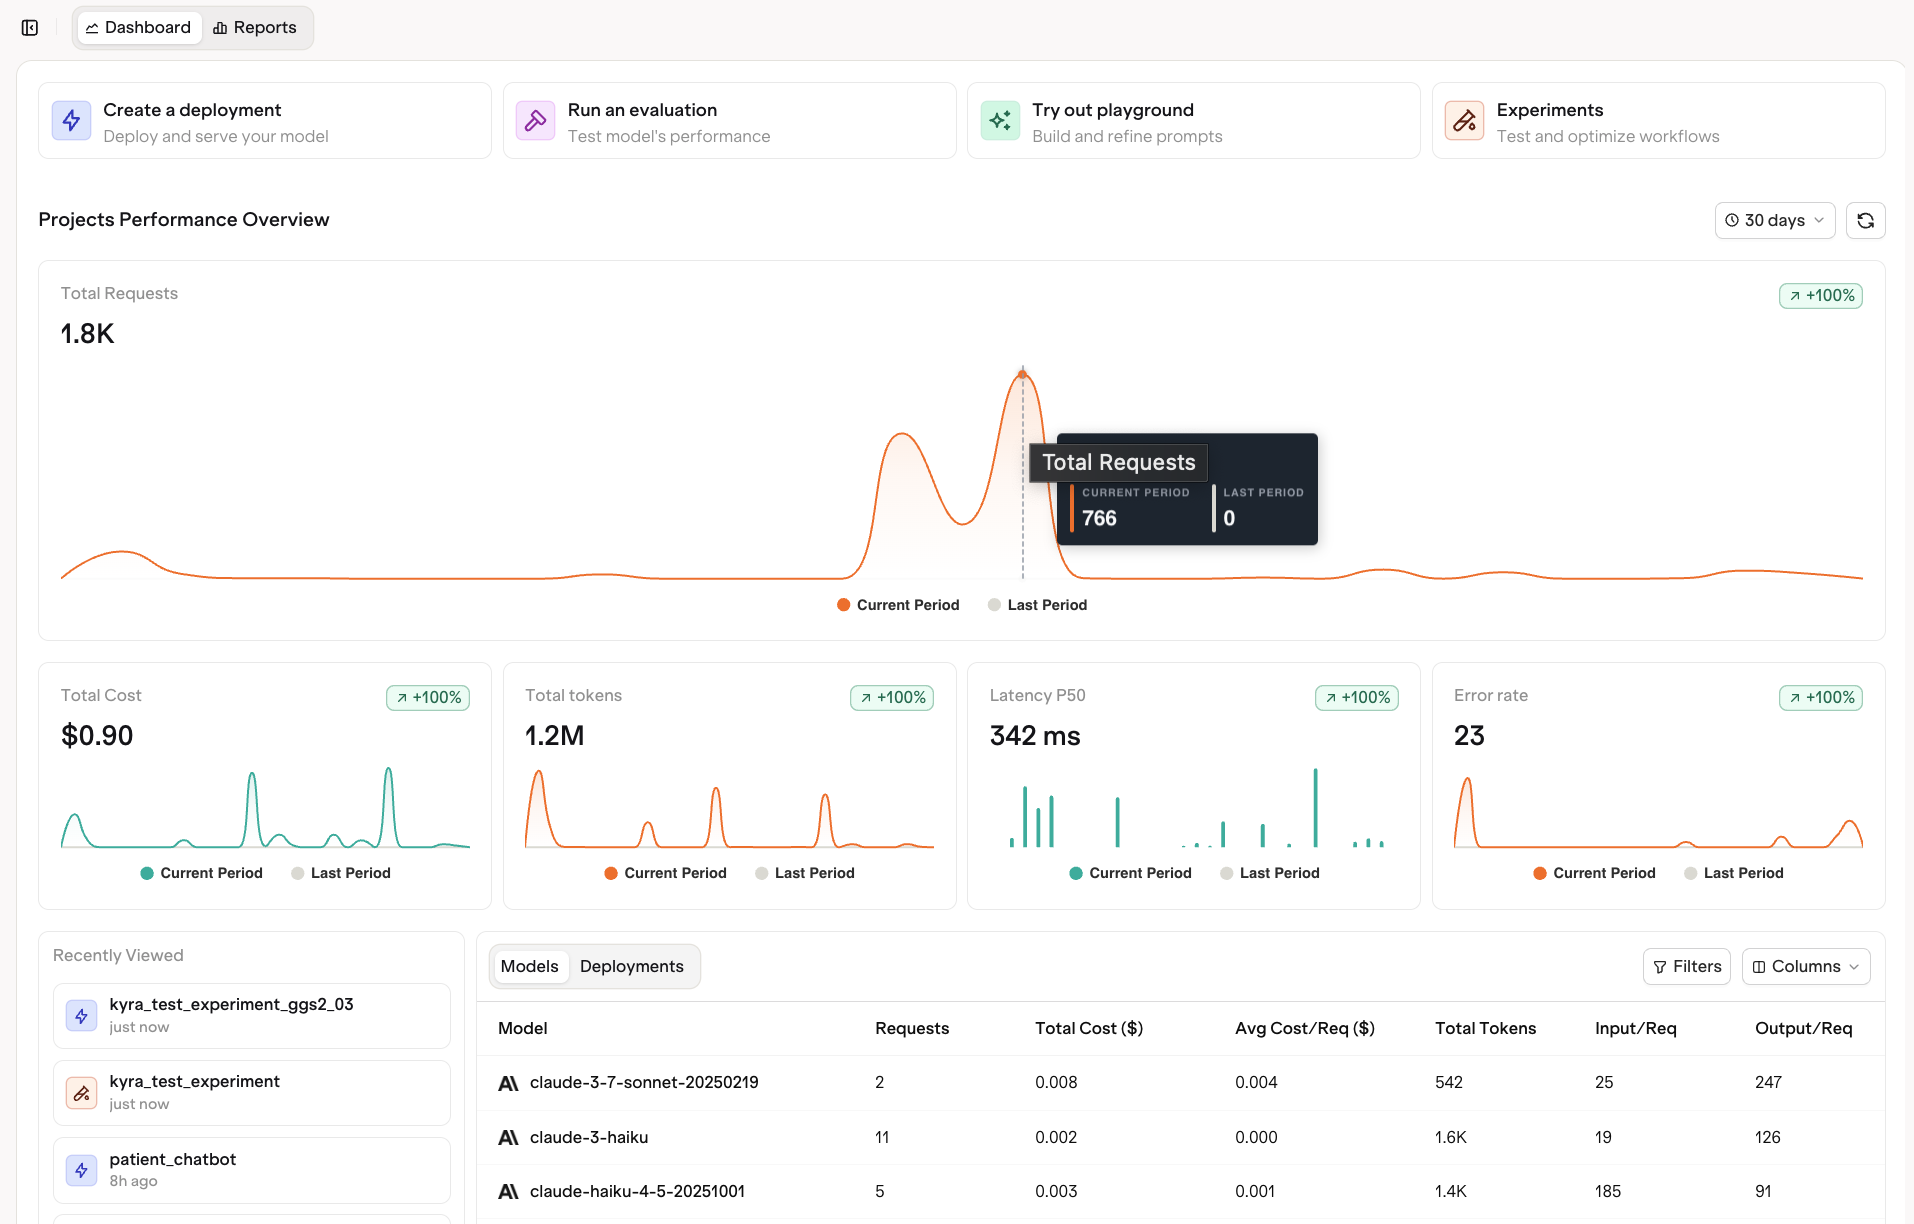
- Quick actions to get started right away. Create a deployment, run an evaluation, open the playground, or start an experiment directly from the dashboard. These workflows used to live in the sidebar, but we have brought them front and center to make your next step obvious and effortless.
- A redesigned layout with central dashboards and overview tables for a clear snapshot of your workspace performance.
- A Recently Viewed section so you can quickly jump back into your most recent experiments, deployments, or files as your workspace grows.
-
Detailed model and deployment insights that help you understand which models drive requests, cost, and latency.
Explore the new Dashboard features in detail at Dashboard.
You can now create self-updating datasets based on your traces using Trace Automations. Instead of manually sorting through the traces, you can define rules that continuously collect the relevant ones for analysis and experimentation.What’s new
- Advanced filtering across any trace attribute such as metadata, model, provider, cost, tokens, or project. Combine multiple filters and apply sampling to focus only on the traces that matter.
- Add to Dataset action that lets you automatically collect traces that match your filters. These datasets stay up to date as new traces arrive, so you can run experiments on the latest production data at any time.
Want to set up Trace Automations? See Trace Automations for setup steps, filtering options, and dataset configuration.
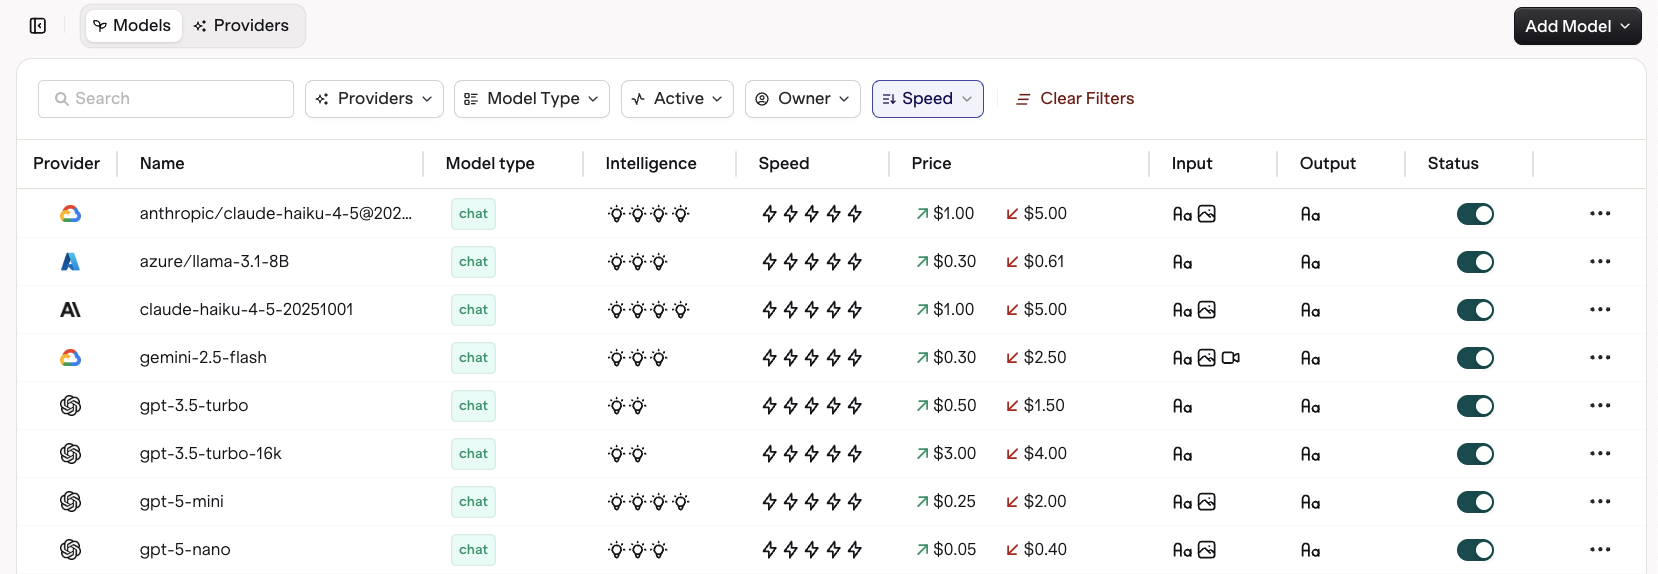
- Multimodality visibility clearly shows which models support text, image, or both for input and output.
- Intelligence and speed ratings help you compare models at a glance based on performance and capability.
- Comprehensive token and pricing data display input and output costs to make budgeting and optimization simple.
- Filter and sort controls across provider, model type, and activity status make model discovery effortless.
- AI Router code snippets are available directly from each model card, letting you copy and deploy instantly through the Orq AI Router.
Learn more about all available models and their capabilities at AI Router.
Mistral and ElevenLabs added as new providers with Bring Your Own Key (BYOK) support
To learn more about Mistral and ElevenLabs BYOK integration, seeIntegrations for setup instructions and Gateway configuration details.
You can now connect and configure your own OpenAI-compatible models directly in Orq. This gives you full flexibility to use custom, self-hosted, or fine-tuned models through the same interface and workflows you already use.Key Components
- Custom model configuration for any OpenAI-compatible endpoint, including chat, completion, embedding, or image models.
- Bring your own API key and base URL to connect private or hosted models securely through the Orq AI Gateway.
- Full parameter control including temperature, max tokens, input and output token pricing, and region.
- Add detailed model descriptions for easy discovery and team collaboration.
- Dataset creation from real production traces
- A/B testing between different models or configurations
-
Evaluator workflows to continuously measure quality and outcomes
Alongside OpenAI-compatible models, you can also connect Azure deployments, Vertex AI models, and LiteLLM instances, each with full setup details available in the documentation.For detailed setup instructions and configuration options, see OpenAI-compatible models.
We have enhanced the comparison experience in Experiments to make it easier to analyze model performance side by side, even when working with large inputs or complex variable replacements.Key Improvements
- Redesigned layout that moves the input variables and expected output to the left, giving you a cleaner overview when comparing multiple models or longer text outputs.
- Evaluator section has been moved to the bottom of the comparison view, keeping the focus on model responses while maintaining quick access to evaluation scores and feedback.
- Optimized for clarity and readability, especially when working with large datasets or extended completions.
Learn how to use the comparison view in Running an Experiment.
You can now save and reuse JSON Schemas directly from your directory, ensuring consistent structured outputs across Deployments, Experiments, and Prompts.
-
Improved JSON editors and clearer validation
To learn more about Structured Outputs, see Creating a Deployment
Dozens of refinements across the platform for a smoother and more consistent experience.
- Enhanced error handling across prompts, tools, and experiments
- Updated icons, spacing, and alignment
- More responsive layouts across Playgrounds, Deployments, and Evaluators
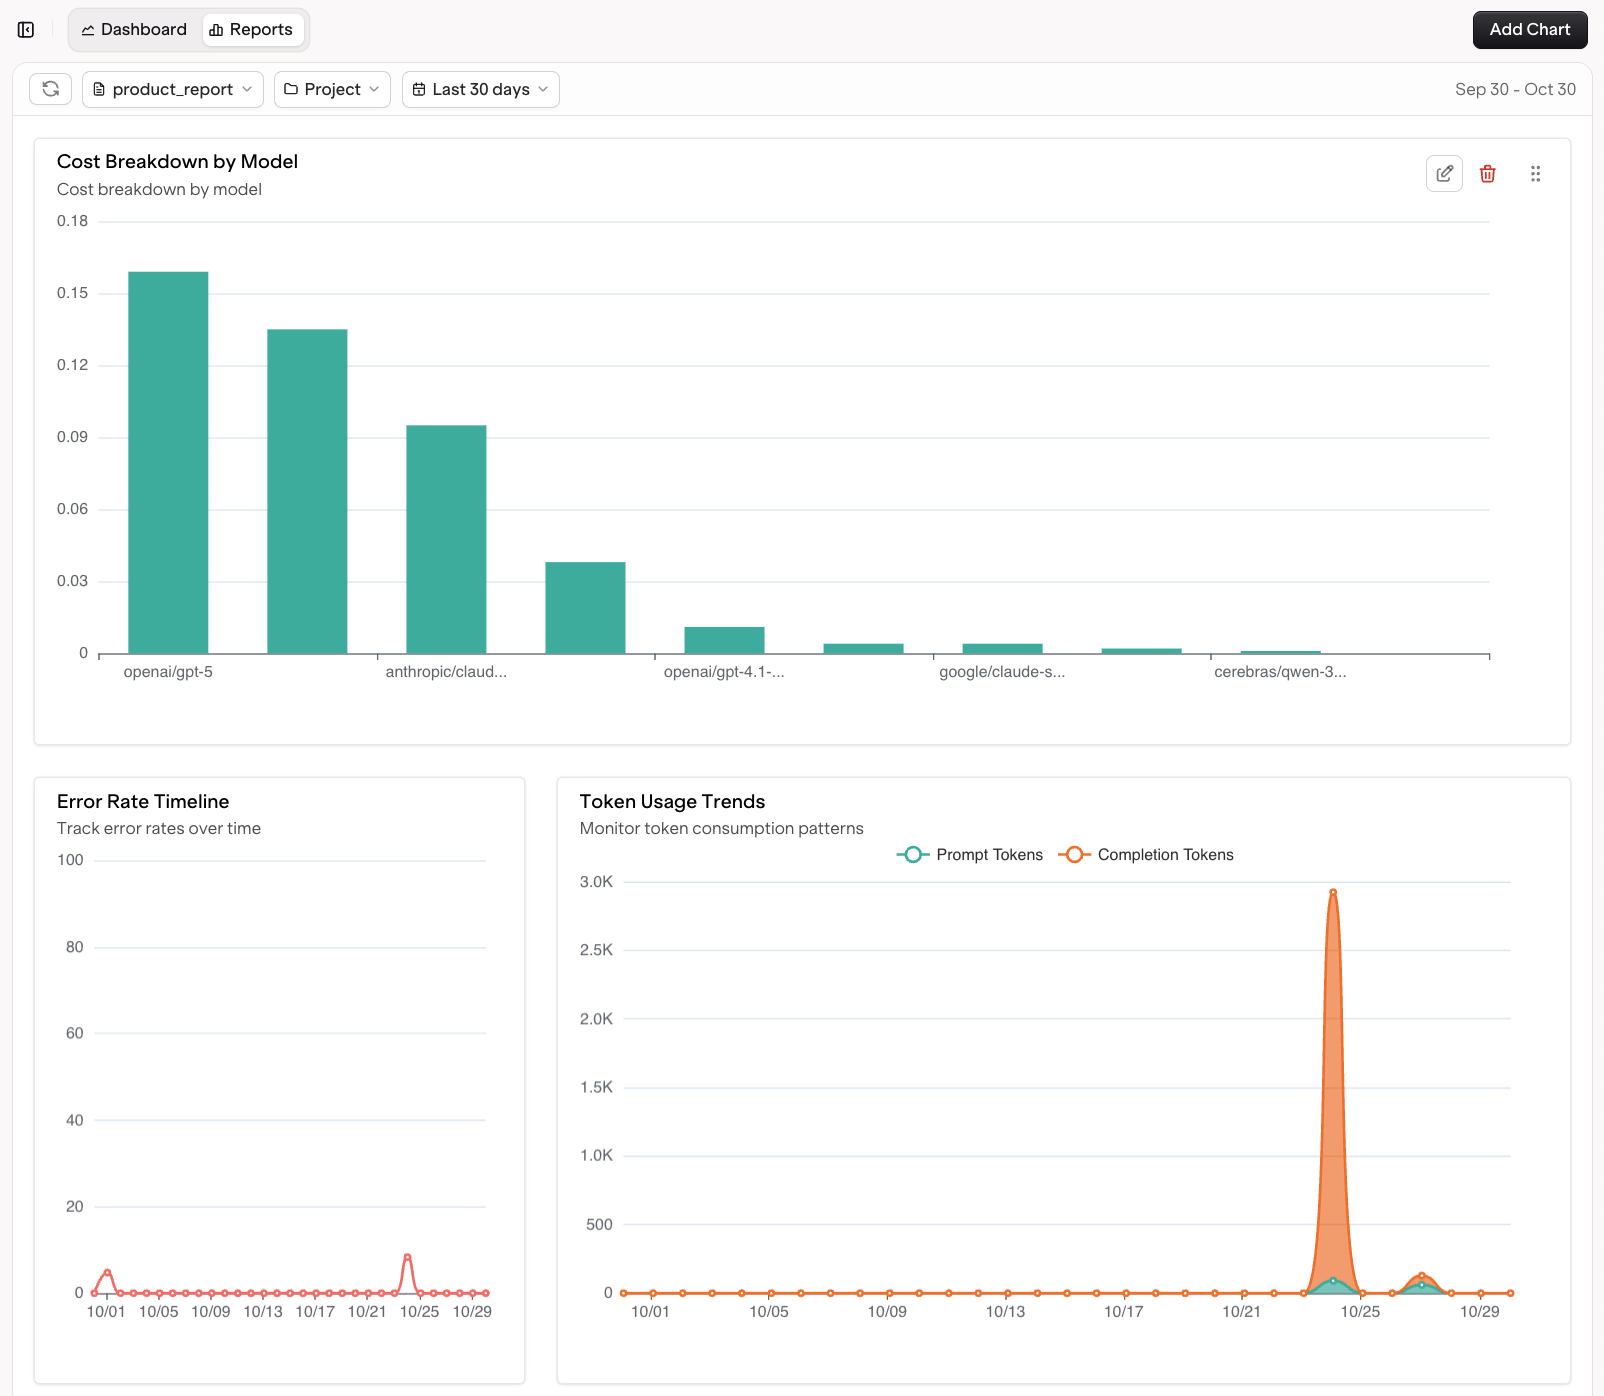
- Customizable views with filters for time range and project selection, allowing you to focus on the data that matters most.
- Build your own custom report by selecting and combining charts from different clusters.
- Comprehensive insights with prebuilt charts for:
- Cost breakdowns and model-provider splits
- Error rates and anomaly detection
- Response time by model and latency analysis
-
Request and token volume tracking
Get started with Custom Reports at Custom Reports.