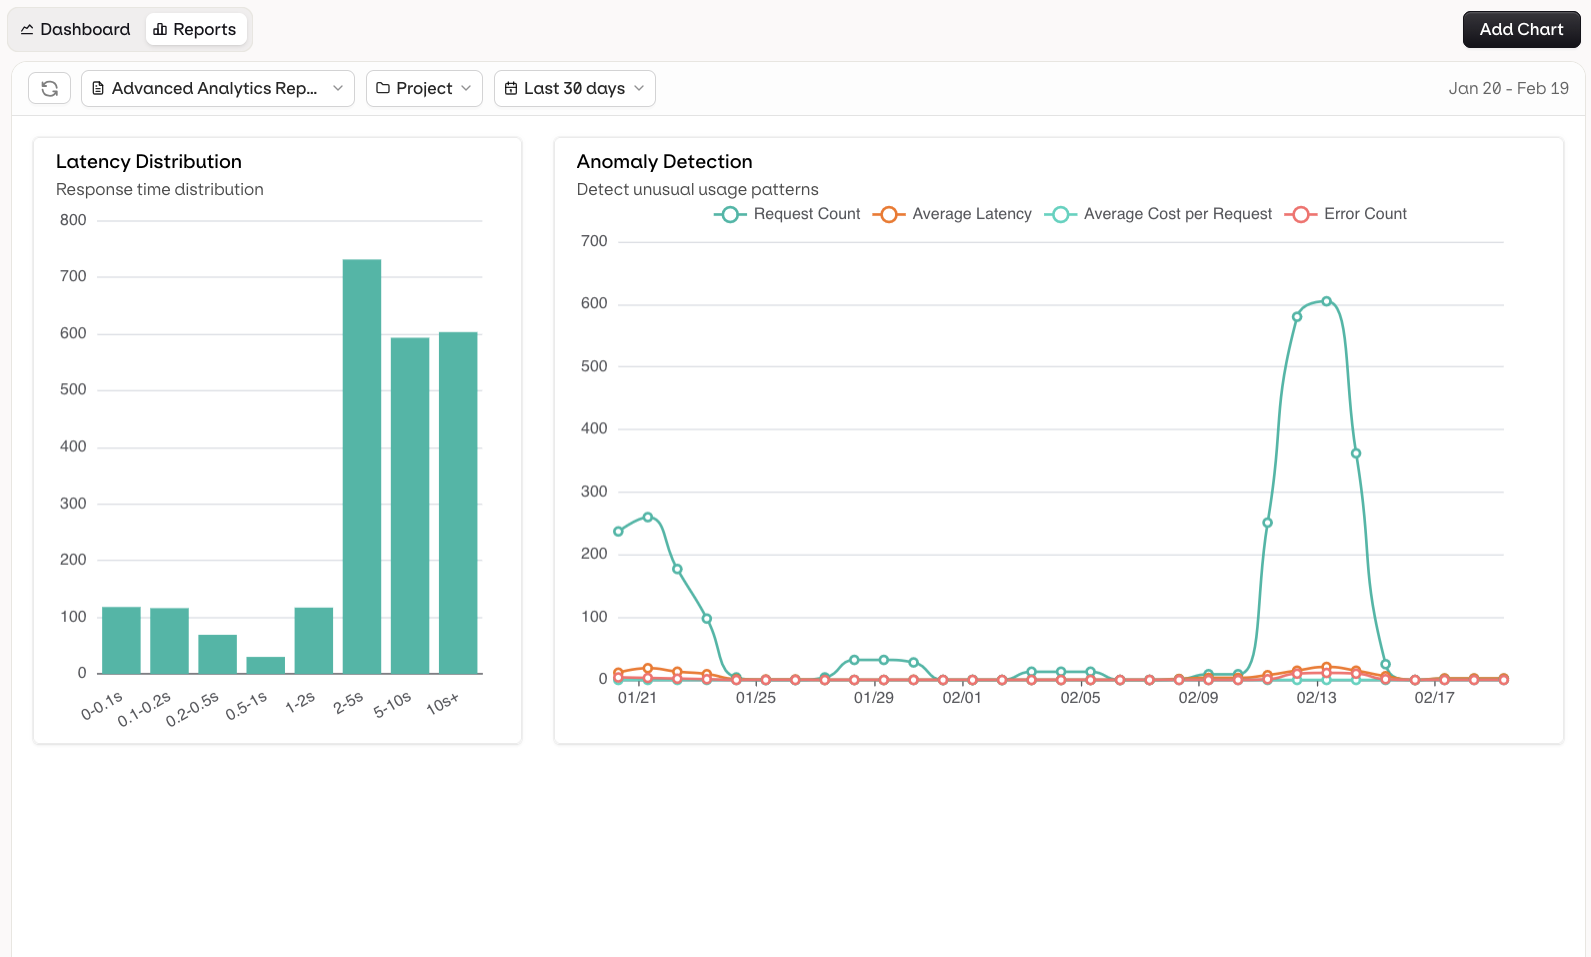
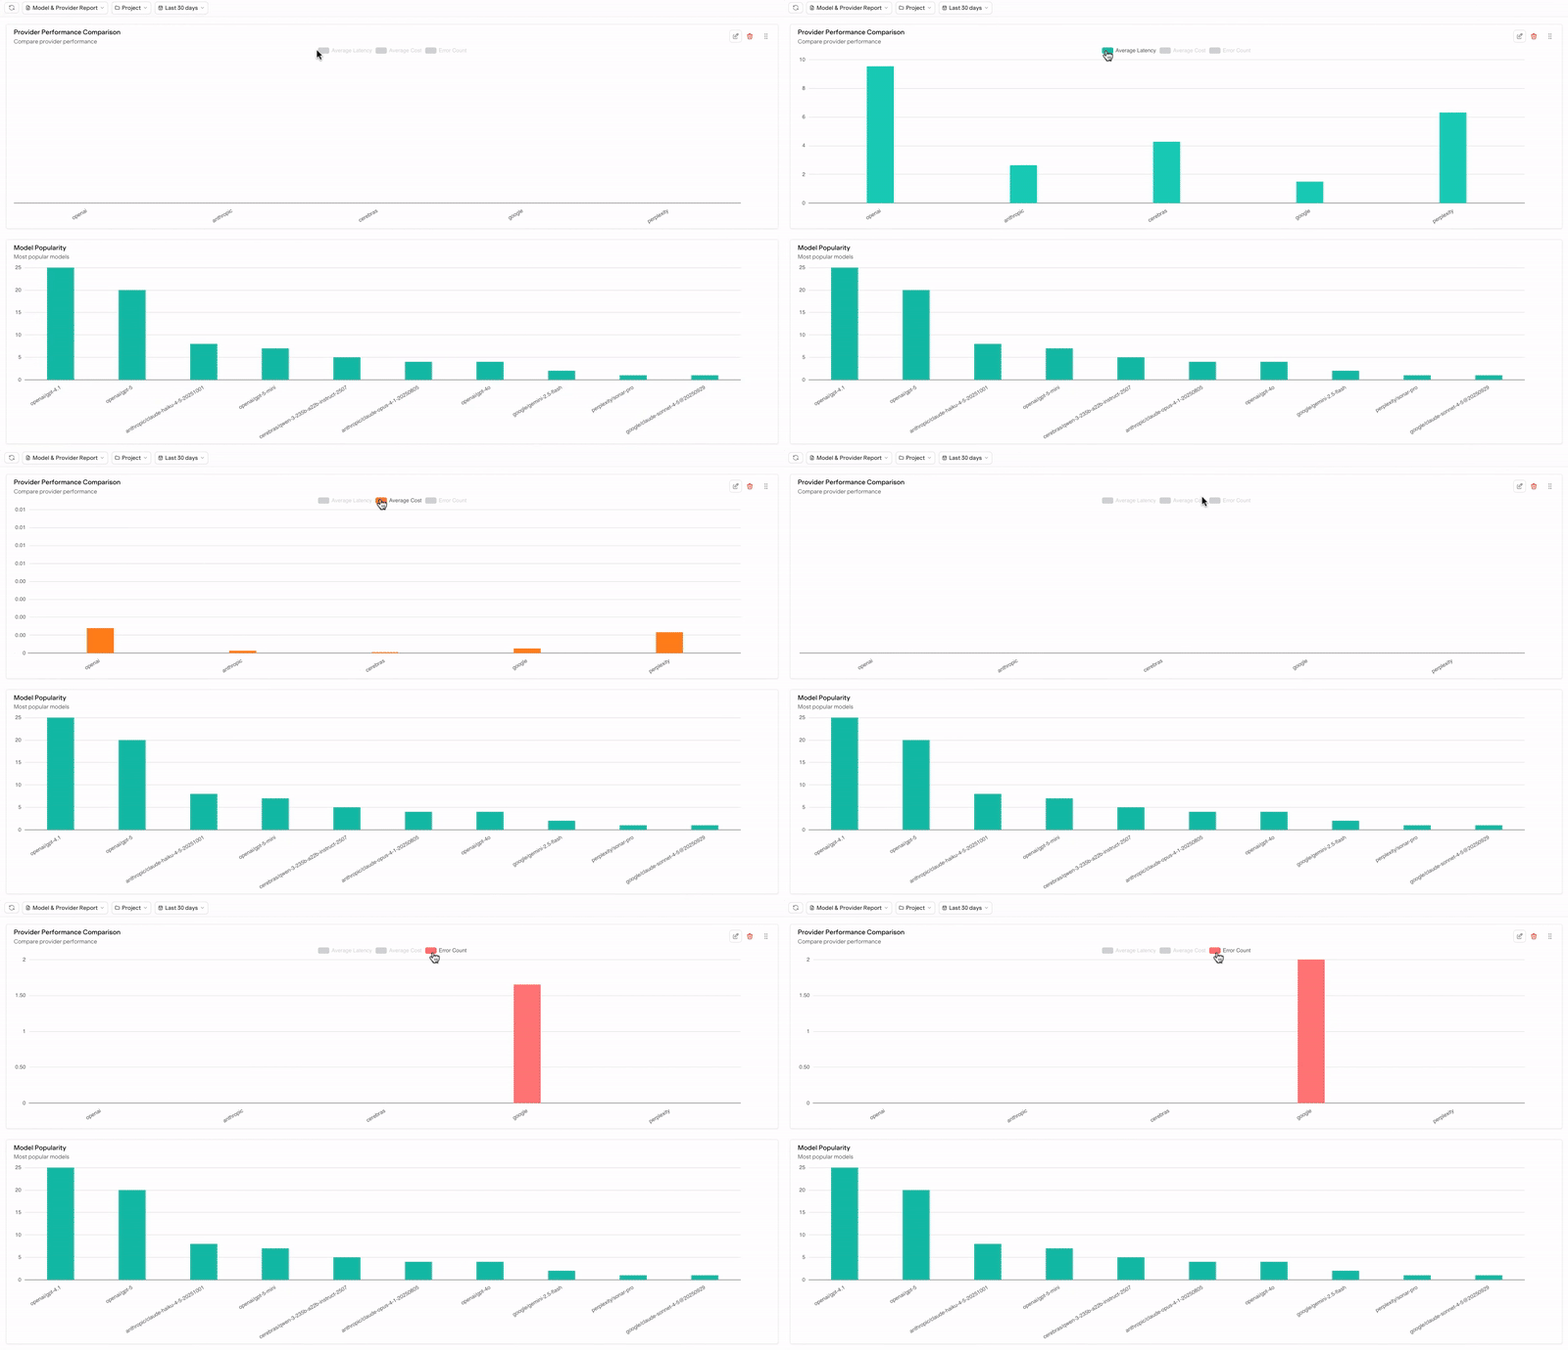
The Reports section provides a complete, real time overview of model usage, performance, and cost across your workspace. With Custom Reports, you can combine off the shelf analytics views, apply filters, and build your own reporting dashboards that match your team’s goals.Documentation Index
Fetch the complete documentation index at: https://docs.orq.ai/llms.txt
Use this file to discover all available pages before exploring further.
Overview
Reports are divided into several clusters, each focused on a specific aspect of your system’s performance. You can use the dropdown at the top of the page to select a report cluster and filter your view by project and time range. Each report updates in real time, giving you immediate insight into how models and deployments are performing in production.Customizing Reports

- Compare total cost and latency trends over the past 30 days
- Analyze error rate distribution for specific deployments
- Examine which providers contribute most to overall usage and cost
Key Metrics and Charts
Custom Reports provide visibility into key performance and cost metrics, including:- Cost breakdowns across providers, models, and deployments
- Latency distribution to identify slow responses
- Response time by model for performance benchmarking
- Error rates and retry frequency
- Request and token volume across time and projects


