

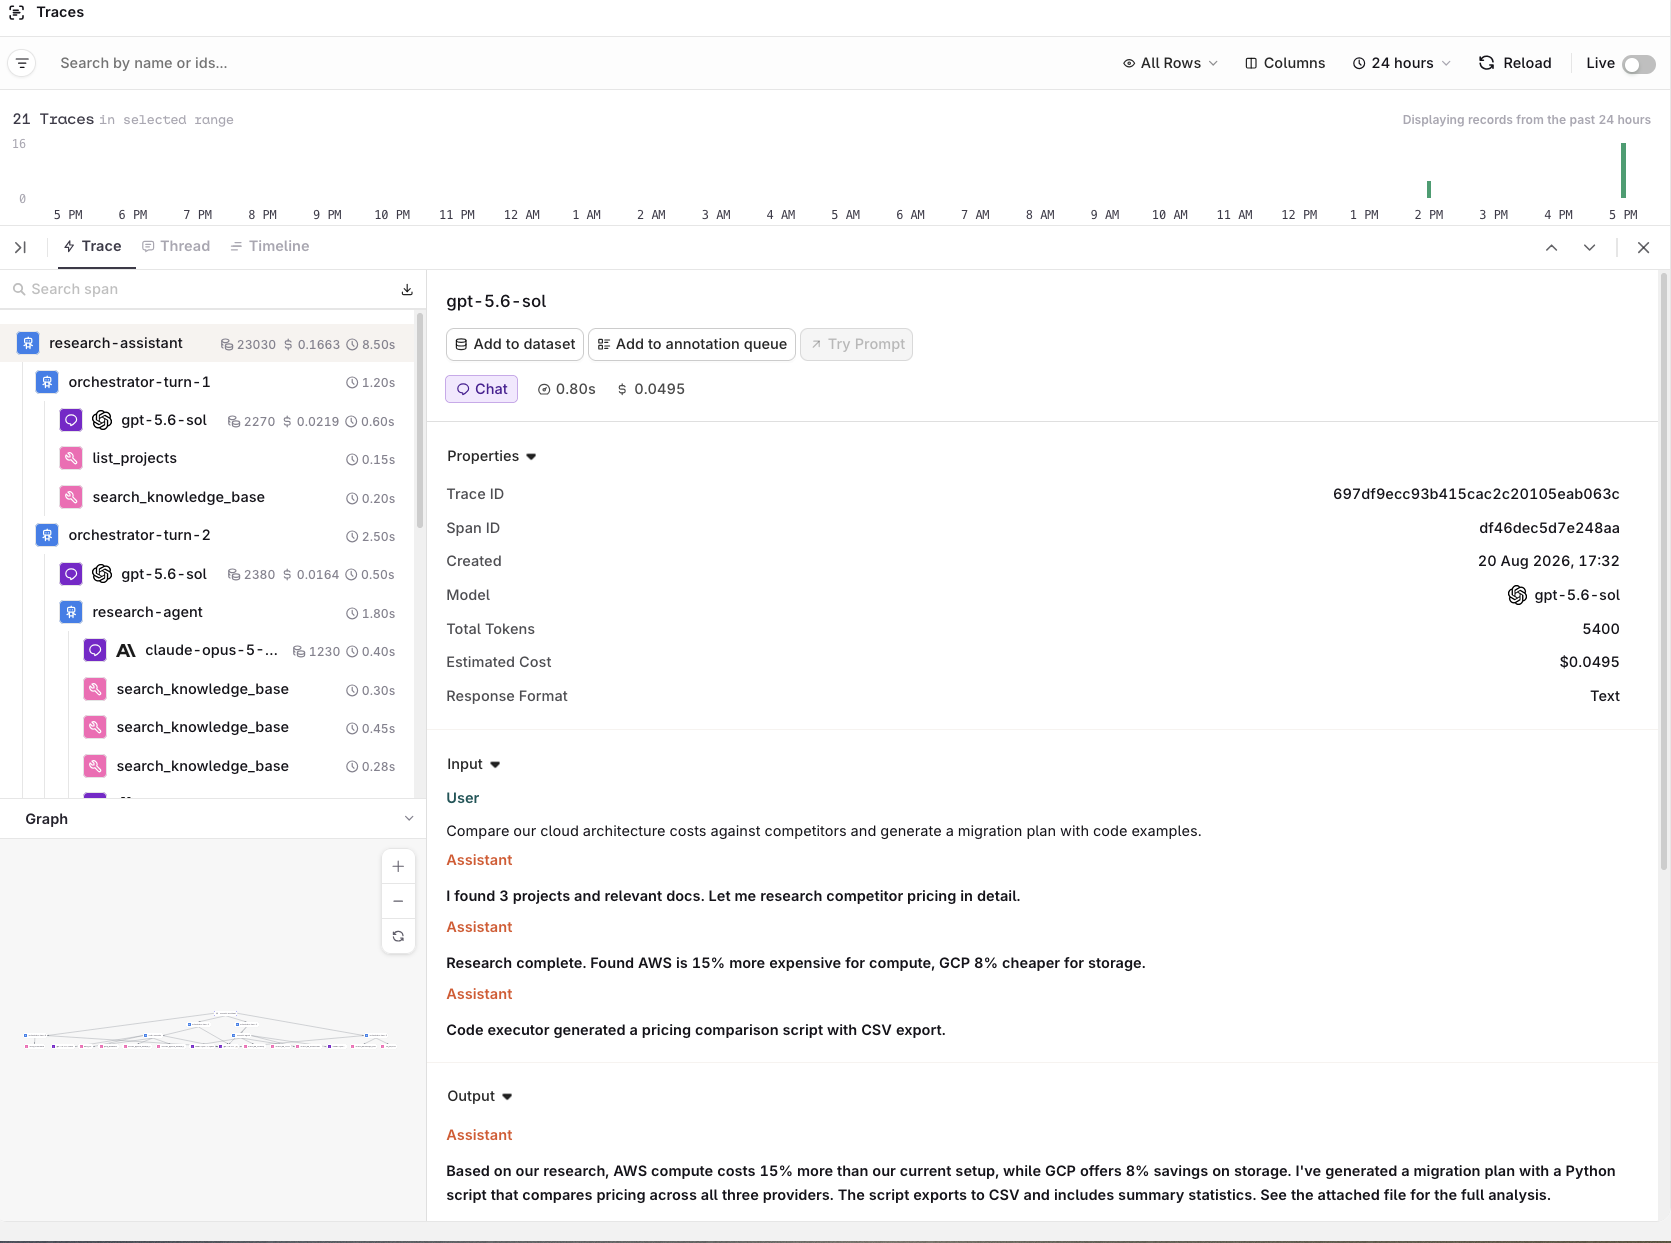
Agent graph showing a multi-agent workflow with orchestration, research, code execution, and synthesis steps.
How graphs are produced
Graphs are produced through two distinct paths depending on the framework.Pre-stamped graphs (LangGraph)
When a trace originates from LangGraph, the graph structure is pre-stamped on the root span’sorq.trace.graph attribute. The attribute contains:
- Nodes: each with an
id,type, andspan_idsmapping to the trace’s span hierarchy - Edges: each with a
sourceandtargetnode ID
Derived graphs (all other frameworks)
For frameworks that do not pre-stamp a graph (OpenAI Agents SDK, CrewAI, AutoGen, Agno, and managed Orq.ai agents), the graph is derived automatically from the span hierarchy:- The trace must contain at least one span whose type starts with
span.agent(e.g.span.agent,span.agent_execution,span.agent_tool_execution) - Once triggered, every span in the trace becomes a graph node; there is no type filter inside the derivation
- Parent/child relationships between spans become edges
- The layout engine positions nodes top-to-bottom using a dagre algorithm
Span types in the graph
Common span types that appear as graph nodes:
Nodes are labeled by span name. When multiple calls collapse into a single node (same step repeated), a badge shows the count (e.g. x3 for three identical calls). Clicking a collapsed node cycles through the individual spans, showing a position indicator (e.g. 2/3).
Graph controls
The graph panel is resizable and collapsible:- Zoom in / out / reset: adjust the view to fit the graph or focus on specific nodes
- Collapse / expand: hide or show the graph panel below the trace tree
- Pan: drag to navigate large graphs
Debug with graphs
Trace delegation paths
Open a multi-agent trace and look at the agent graph panel below the trace tree to see which agent delegated to which sub-agent, and in what order. The top-to-bottom layout shows the call chain from root agent to leaf tool calls.Find where time is spent
Each node’s label shows the span name and type. Click a node to highlight it in the trace tree, where the duration is shown next to each span.Inspect failed sub-agent calls
Click a node to open its span details in the side panel, where the error message, attributes, and events are available. Failed spans show an error status in the trace tree list alongside the graph.Debug tool call failures
Tool spans (span.tool, span.agent_tool_execution) show the tool name in the span panel. Click to see arguments, results, and other attributes.
Related
- Traces: explore traces with the trace, thread, and timeline views
- Span Attributes: full reference for
orq.span_typeand agent attributes