

What Are Alerts
Traces record what happened. Alerts report when it happened, without anyone having to look. An Alert watches one metric in one Project, on a chosen schedule, and sends a notification the moment that metric crosses a defined threshold. A second notification follows when the metric recovers.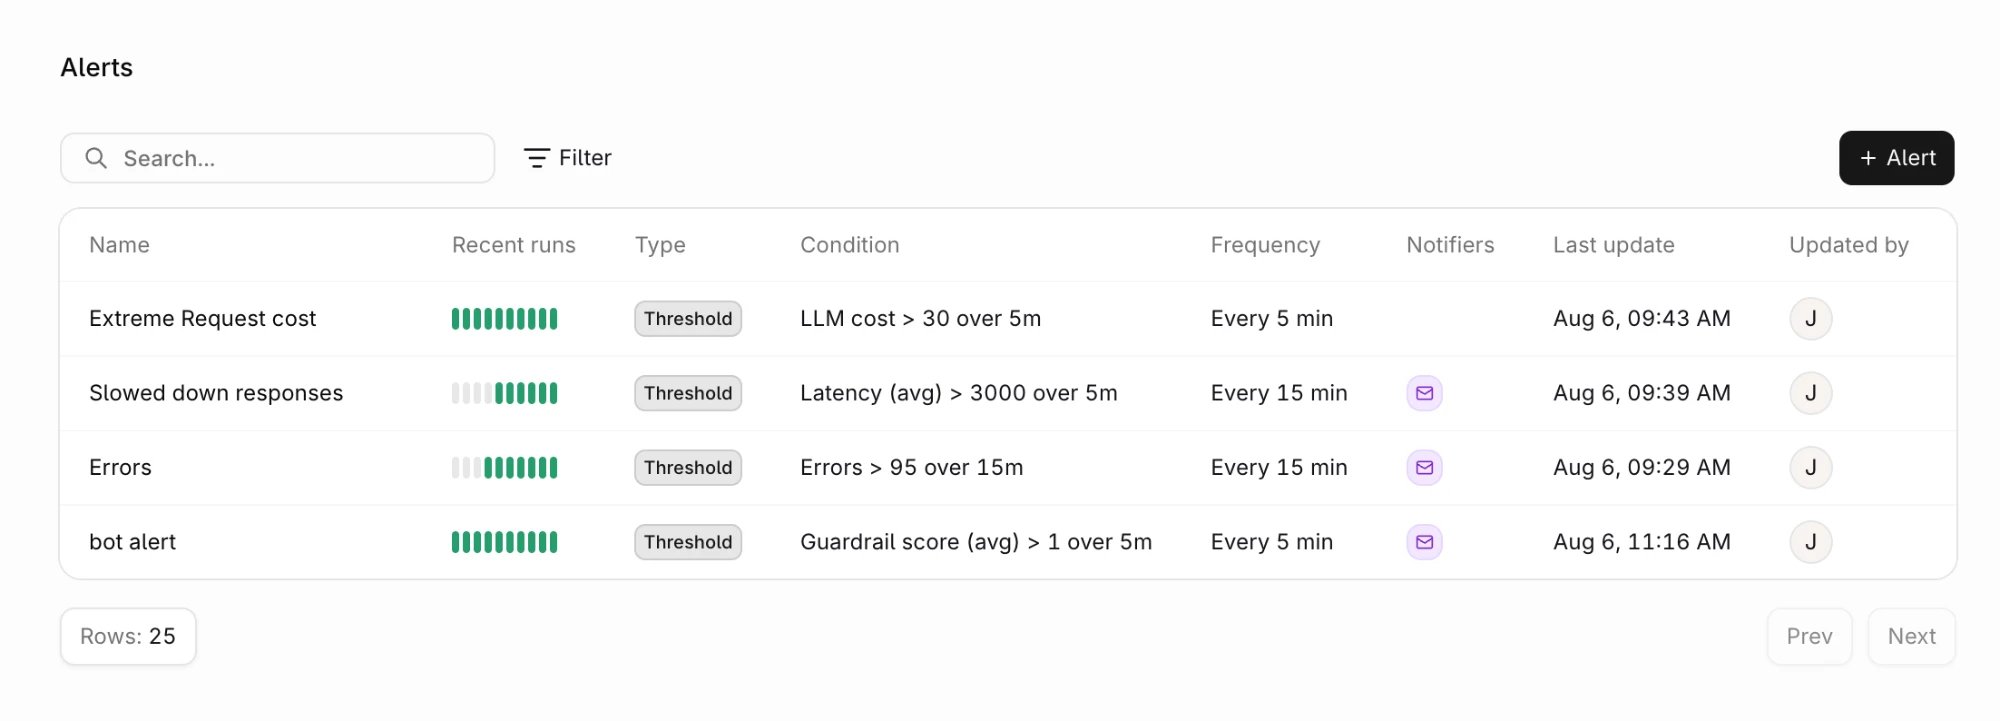
The Alerts overview, listing each alert with its condition, check frequency, and recent run history.
What Alerts Can Watch
Alerts are built around four signals, each mapped to the metrics that matter for it.Suspicious cost
Catch spend spikes before the invoice does. A runaway retry loop, a prompt
that grew, or a switch to a more expensive model surfaces within minutes.
Unusual latency
Watch average or p95 latency. Provider degradation and slow tool calls
appear here long before they register as errors.
Guardrail results
Watch guardrail pass rate or average guardrail score. A drop means the
model started producing output the checks reject, the earliest available
signal that quality regressed.
Errors
Watch failed request counts or error rate, scoped to a provider, model,
or Deployment.
Experiment runs are excluded from alert calculations, so experiment data
does not contribute to alert thresholds.
Creating An Alert
- AI Studio
- API / SDK
 AI Studio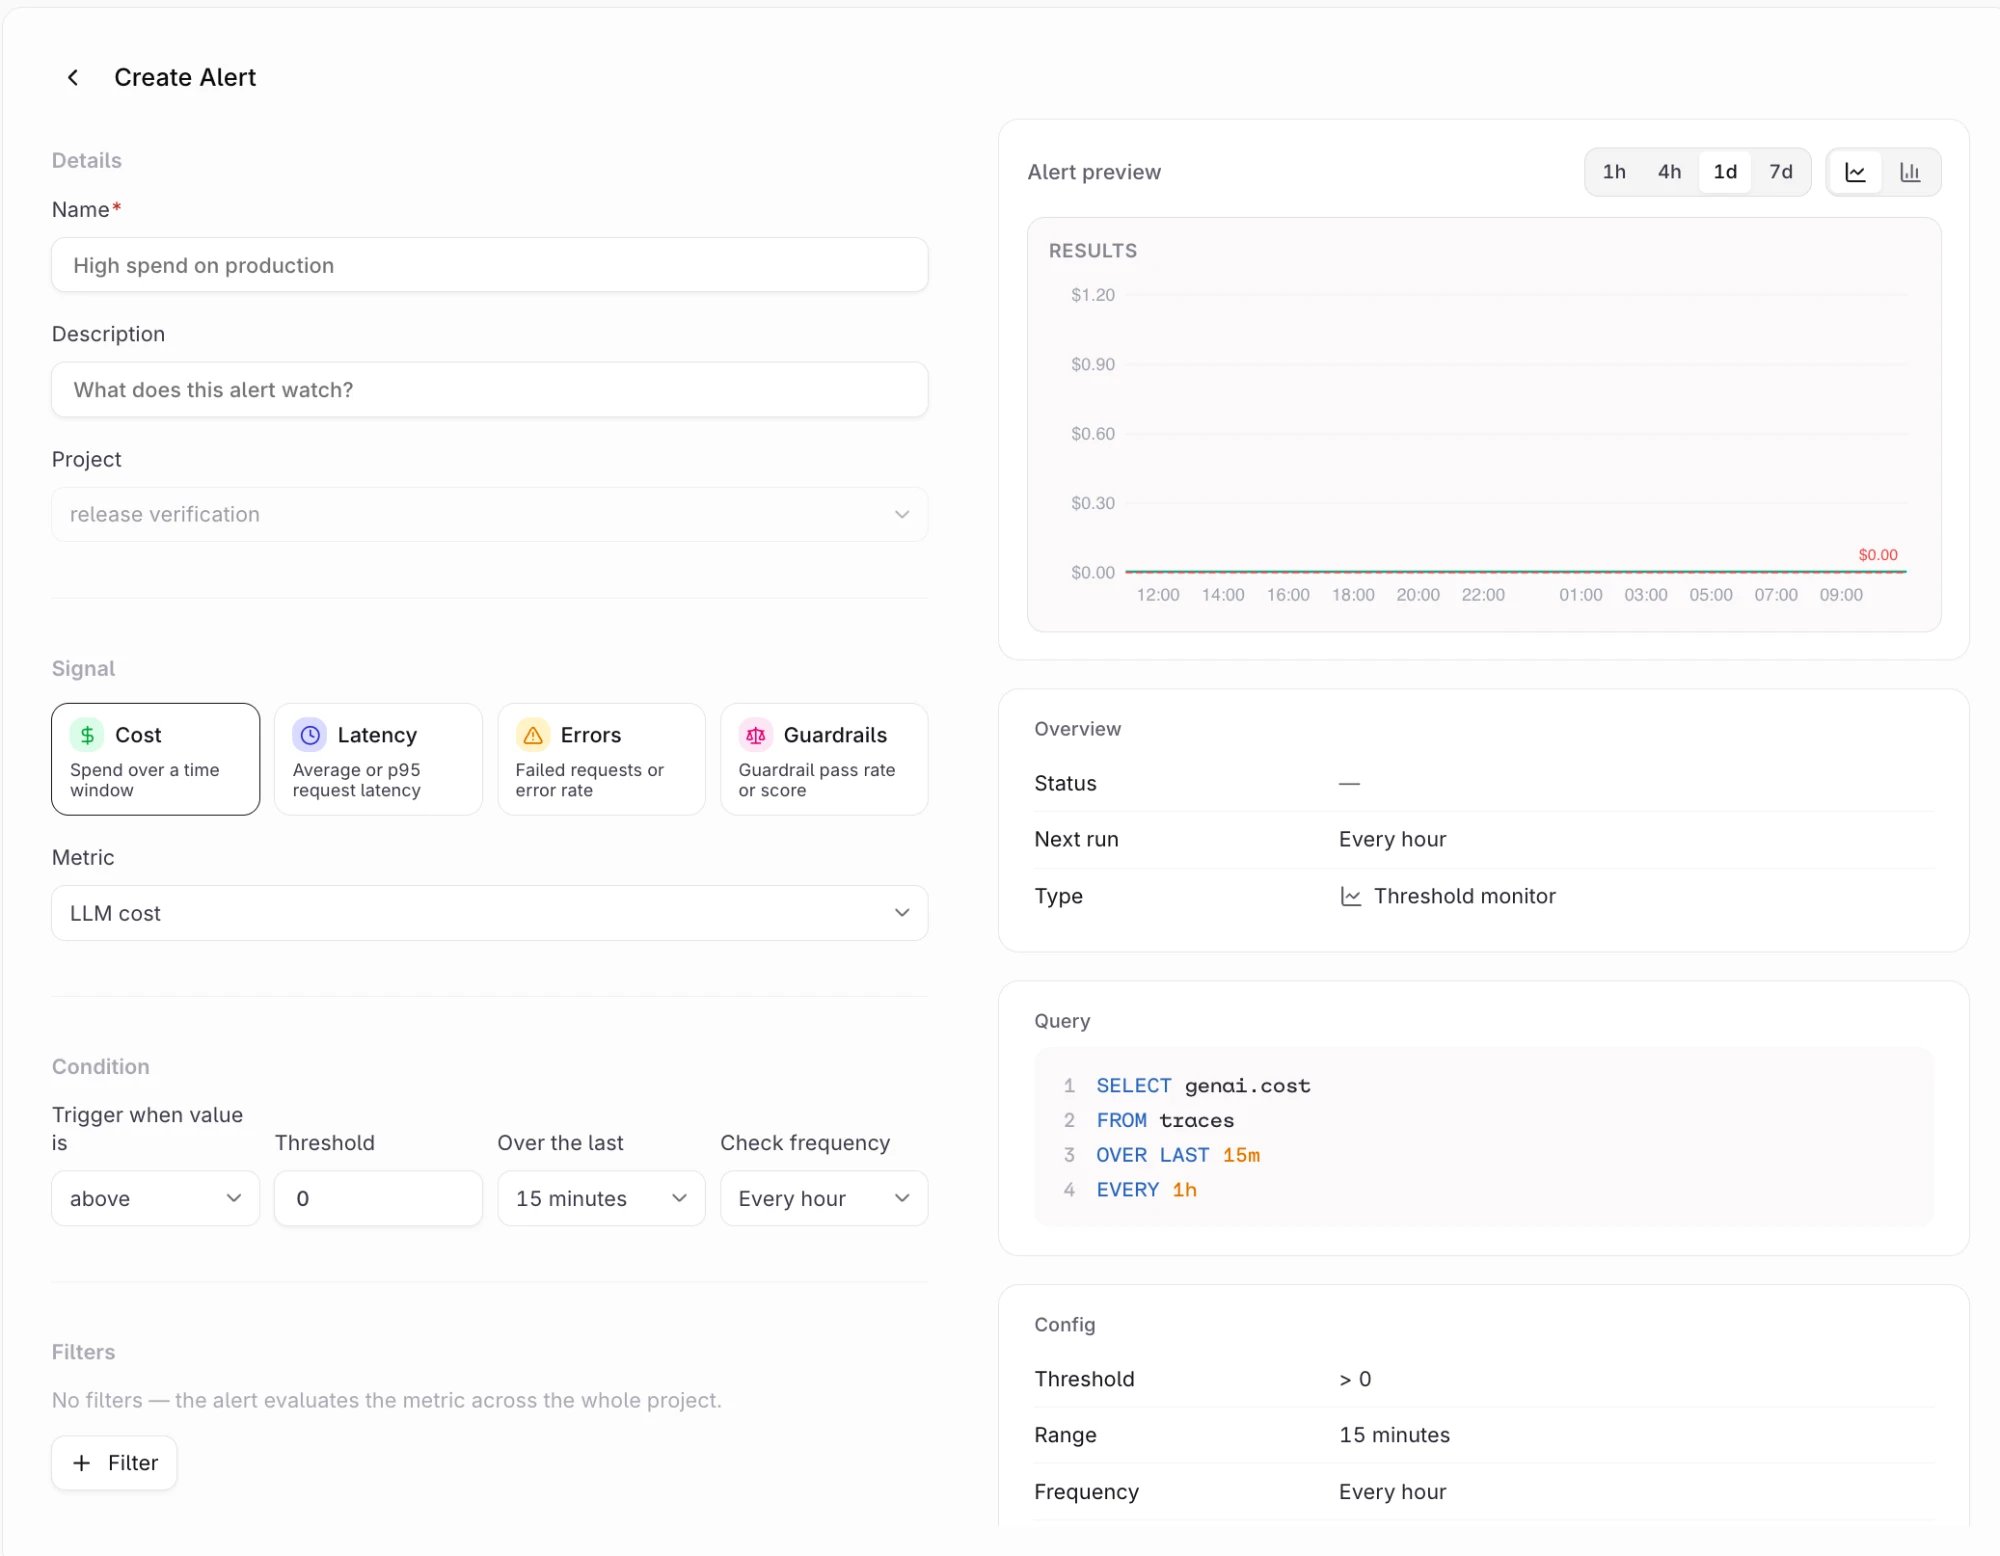
The create form. The preview pane on the right resolves the query and config before saving.
1
Open Alerts
Head to Observability in the AI Studio, select the Alerts tab, then choose + Alert.
2
Name the alert
Enter a Name that describes the problem rather than the metric.
High spend on production reads better than cost alert. Names must be unique within the workspace.Add an optional Description, and confirm the Project. An Alert belongs to exactly one Project, and the Project cannot be changed after creation.3
Choose a signal and metric
Pick Cost, Latency, Errors, or Guardrails, then choose the Metric. The default is
LLM cost.The Guardrails signal adds a guardrail picker. Leaving it empty covers every guardrail in the Project. Selecting specific Guardrails limits the alert to those.4
Set the condition
The condition reads as a single sentence: trigger when the value is [comparator] [threshold] over the last [window], checked [frequency].See Condition options for the full set of values, and note that thresholds are entered in each metric’s own unit.
5
Narrow the scope with filters
Without filters, the Alert evaluates the metric across the whole Project. Filters restrict it to a specific slice. This step is optional. See Filters.
6
Choose where it notifies
Under Notify via, select one or more Notifiers, up to 10 per Alert. Notifiers are reusable destinations for email, Slack, or generic webhooks, managed under Settings > Notifiers. See Notifiers for the channels and their fields, or create one inline from the form.Notifiers are optional. An Alert without any still evaluates and records its triggers, but notifies nobody.
7
Check the preview, then save
The right-hand pane plots the metric over 1h, 4h, 1d, or 7d alongside the resolved query and stored config. Use it to check the threshold against real traffic before committing. A threshold that has never been crossed is as unhelpful as one that fires constantly.Choose Create Alert. New Alerts are enabled immediately.
Condition Options
Thresholds are entered in each metric’s own unit:
Filters
In AI Studio, filters use theis and is not operators on the following fields:
provider, model, identity, agent, deployment, evaluator, evaluator name
The API accepts the operators eq, neq, in, and not_in on alert filters; see the create an alert reference.
Each filter group uses a single field and a single operator. An Alert can carry up to 18 filters, or 16 on genai.evaluator.score.avg.
Alert Lifecycle
An Alert runs on its check frequency and holds one of three statuses:
A breach opens a trigger, an incident record that stays open until the metric recovers and then closes as
resolved. If the metric stops reporting entirely, the trigger resolves on its own once a full evaluation window plus the ingestion delay passes without data, and the next breach opens a fresh incident. This matters for metrics that only report while something runs, such as Evaluators. Notifications fire twice per incident: once when the trigger opens, once when it resolves. No repeat-notification interval exists, so a long-running incident will not flood an inbox.
Each trigger retains its supporting evidence, including the evaluated value, the threshold it crossed, and the runs that led there, making it possible to move from a notification to the Traces that caused it.
Managing Alerts
- AI Studio
- API / SDK
From the Alerts list:
- Enable or disable an Alert. A disabled Alert stops evaluating but keeps its trigger history.
- Duplicate an Alert as the starting point for a variant. Duplicates are created disabled, allowing the threshold to be adjusted before it fires.
- Edit any field except the Project.
- Delete an Alert along with its history.
Plan Limits
The number of Alerts and the minimum check frequency depend on the active plan:
Saving an Alert with a frequency below the plan minimum returns
evaluation interval 5m is below your plan's minimum of 1h0m0s.
Next Steps
Traces
Investigate the requests behind a trigger.
Automations
Act on matching traces automatically instead of only notifying.