

What Are Monitors
A Monitor is a custom dashboard made of widgets. Each widget charts one query over Traces, Metrics, or Logs, so a team can keep the numbers it cares about on a single page: cost per model, p95 latency, evaluator pass rate, and more.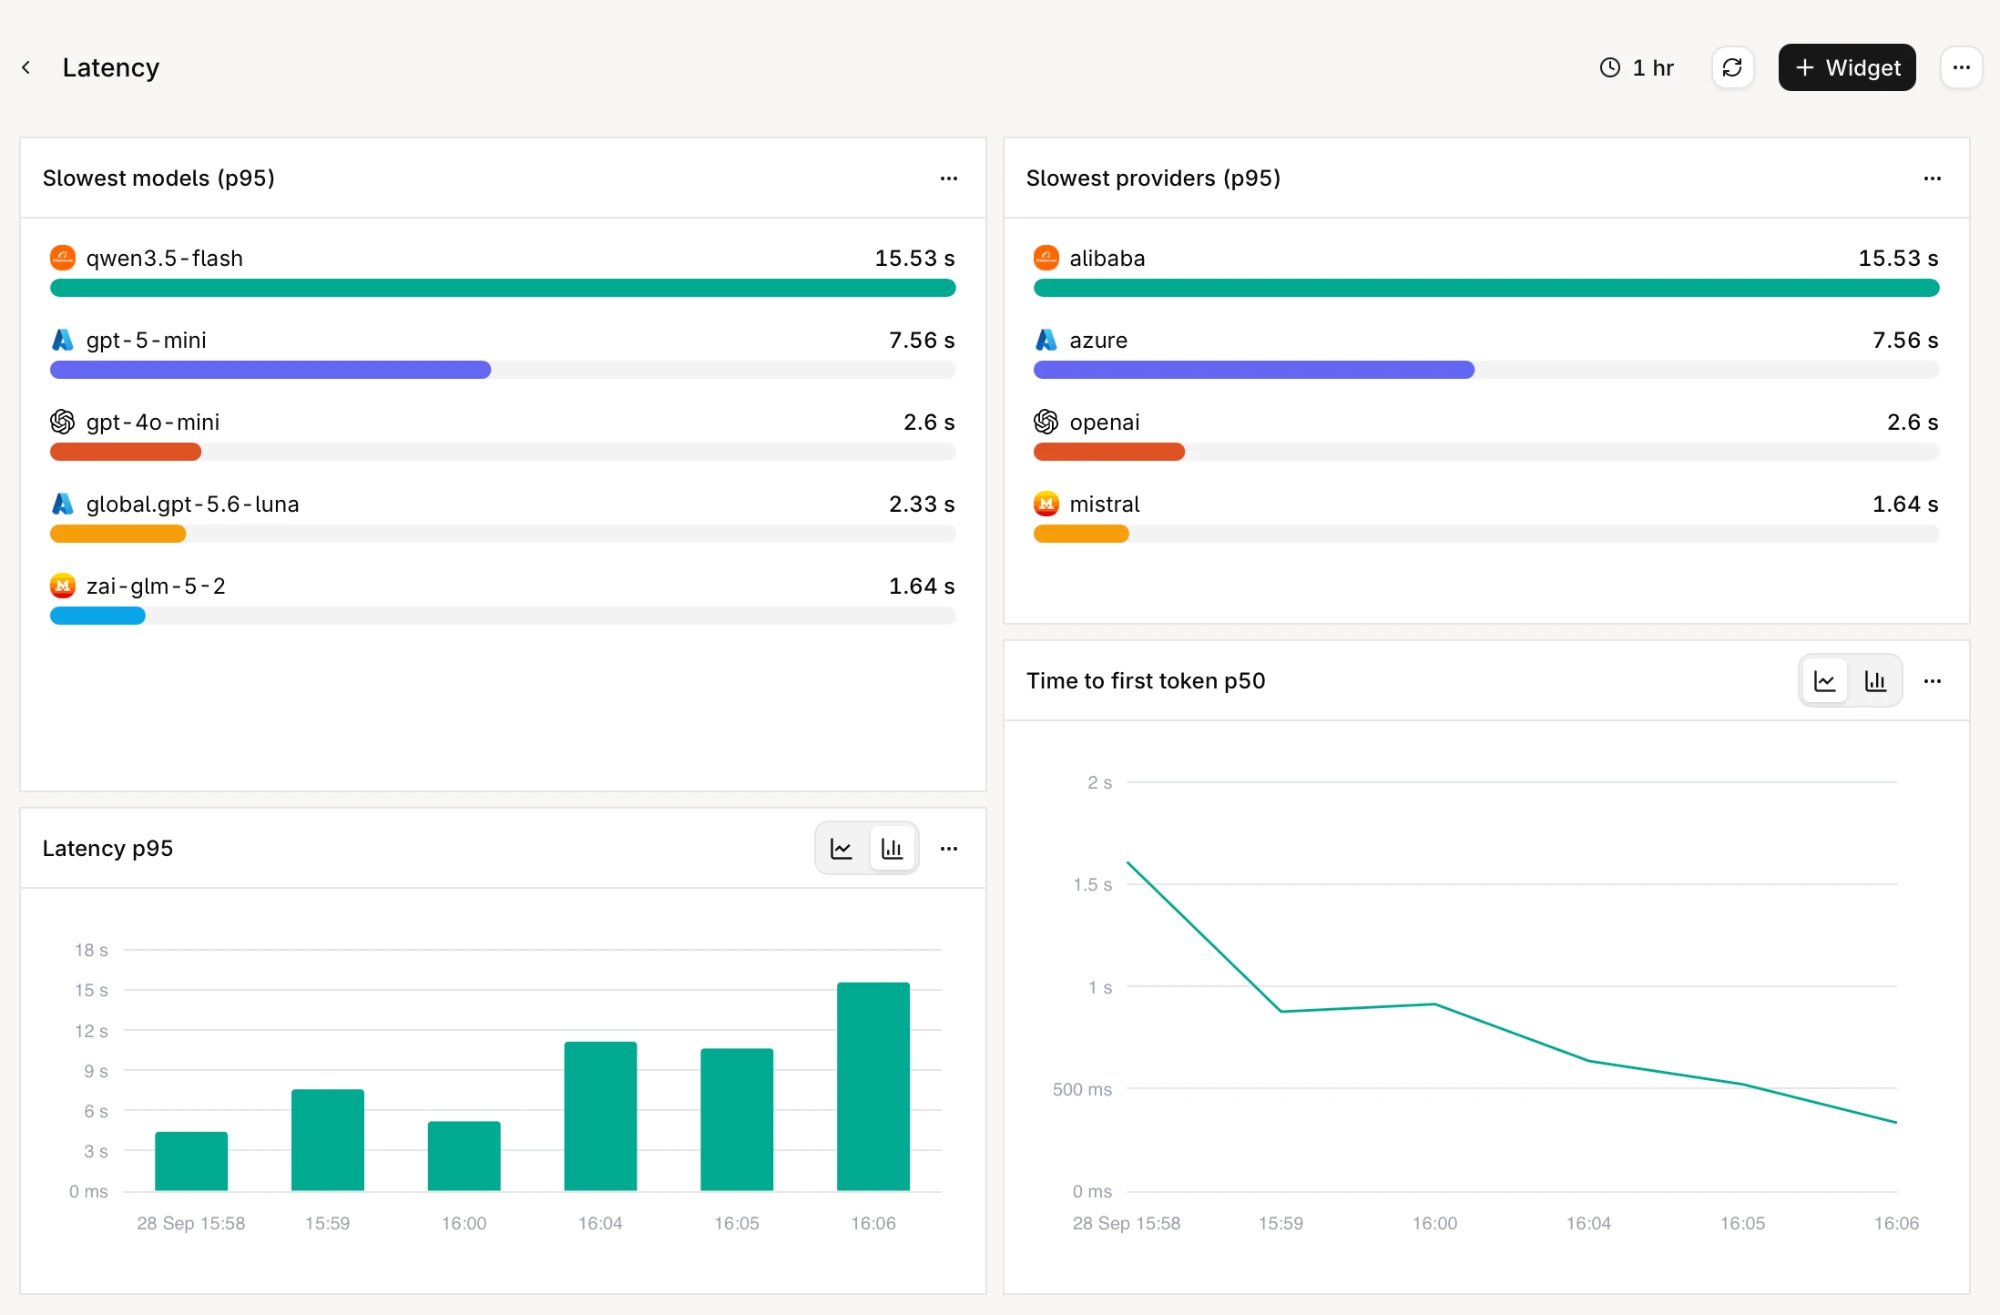
A Monitor built from the Latency template, with top list and time series widgets over the last hour.
- Workspace: charts data across every Project in the workspace. Only workspace admins can create, edit, or delete workspace Monitors.
- Project: charts data from a single Project.
Creating a Monitor
- AI Studio
- API & SDK
 AI Studio
1
Open Monitors
Head to Observability in the AI Studio, select the Monitors tab, then choose + Monitor.
2
Name the monitor
Enter a Name and an optional Description of what the Monitor tracks.
3
Choose the scope
Select Workspace or a Project. Workspace admins see Workspace as the default. Other members only see the Projects they have access to.
4
Pick a template
Under Start from template, keep Blank monitor or start from a ready-made dashboard. See Templates.
5
Set the default range
Default range is the time window the dashboard opens with. Automatic uses the standard range. Ranges beyond the plan’s data retention are not offered.
6
Create
Choose Create monitor. The dashboard opens straight away.
Templates
Every widget created from a template can be edited, moved, or deleted like any other.
Using the Dashboard
The dashboard header holds the controls for the whole Monitor:- Time range: pick a preset range or a custom range. The range applies to every widget and is kept in the page URL, so a link to the dashboard opens the same window. Ranges are capped at the plan’s data retention.
- Refresh: reloads every widget.
- + Widget: opens the widget editor. See Adding a Widget.
- Monitor actions: Settings, Duplicate, and Delete.
Widget actions
Open the menu on a widget to:- Edit: reopen the widget in the editor.
- Duplicate: add a copy to the same Monitor.
- Create alert: open the Alerts form with the widget’s metric, filters, and Project already filled in. A widget’s target line becomes the alert threshold. Available for GenAI metrics from Traces. Alerts have no split, so Split results by is not carried over, and a workspace Monitor needs a Project picked in the form. The alert’s Notifiers are selected in that form.
- Delete: remove the widget.
Adding a Widget
The widget editor has the configuration on top and a live Preview of the widget below, using the dashboard’s current time range.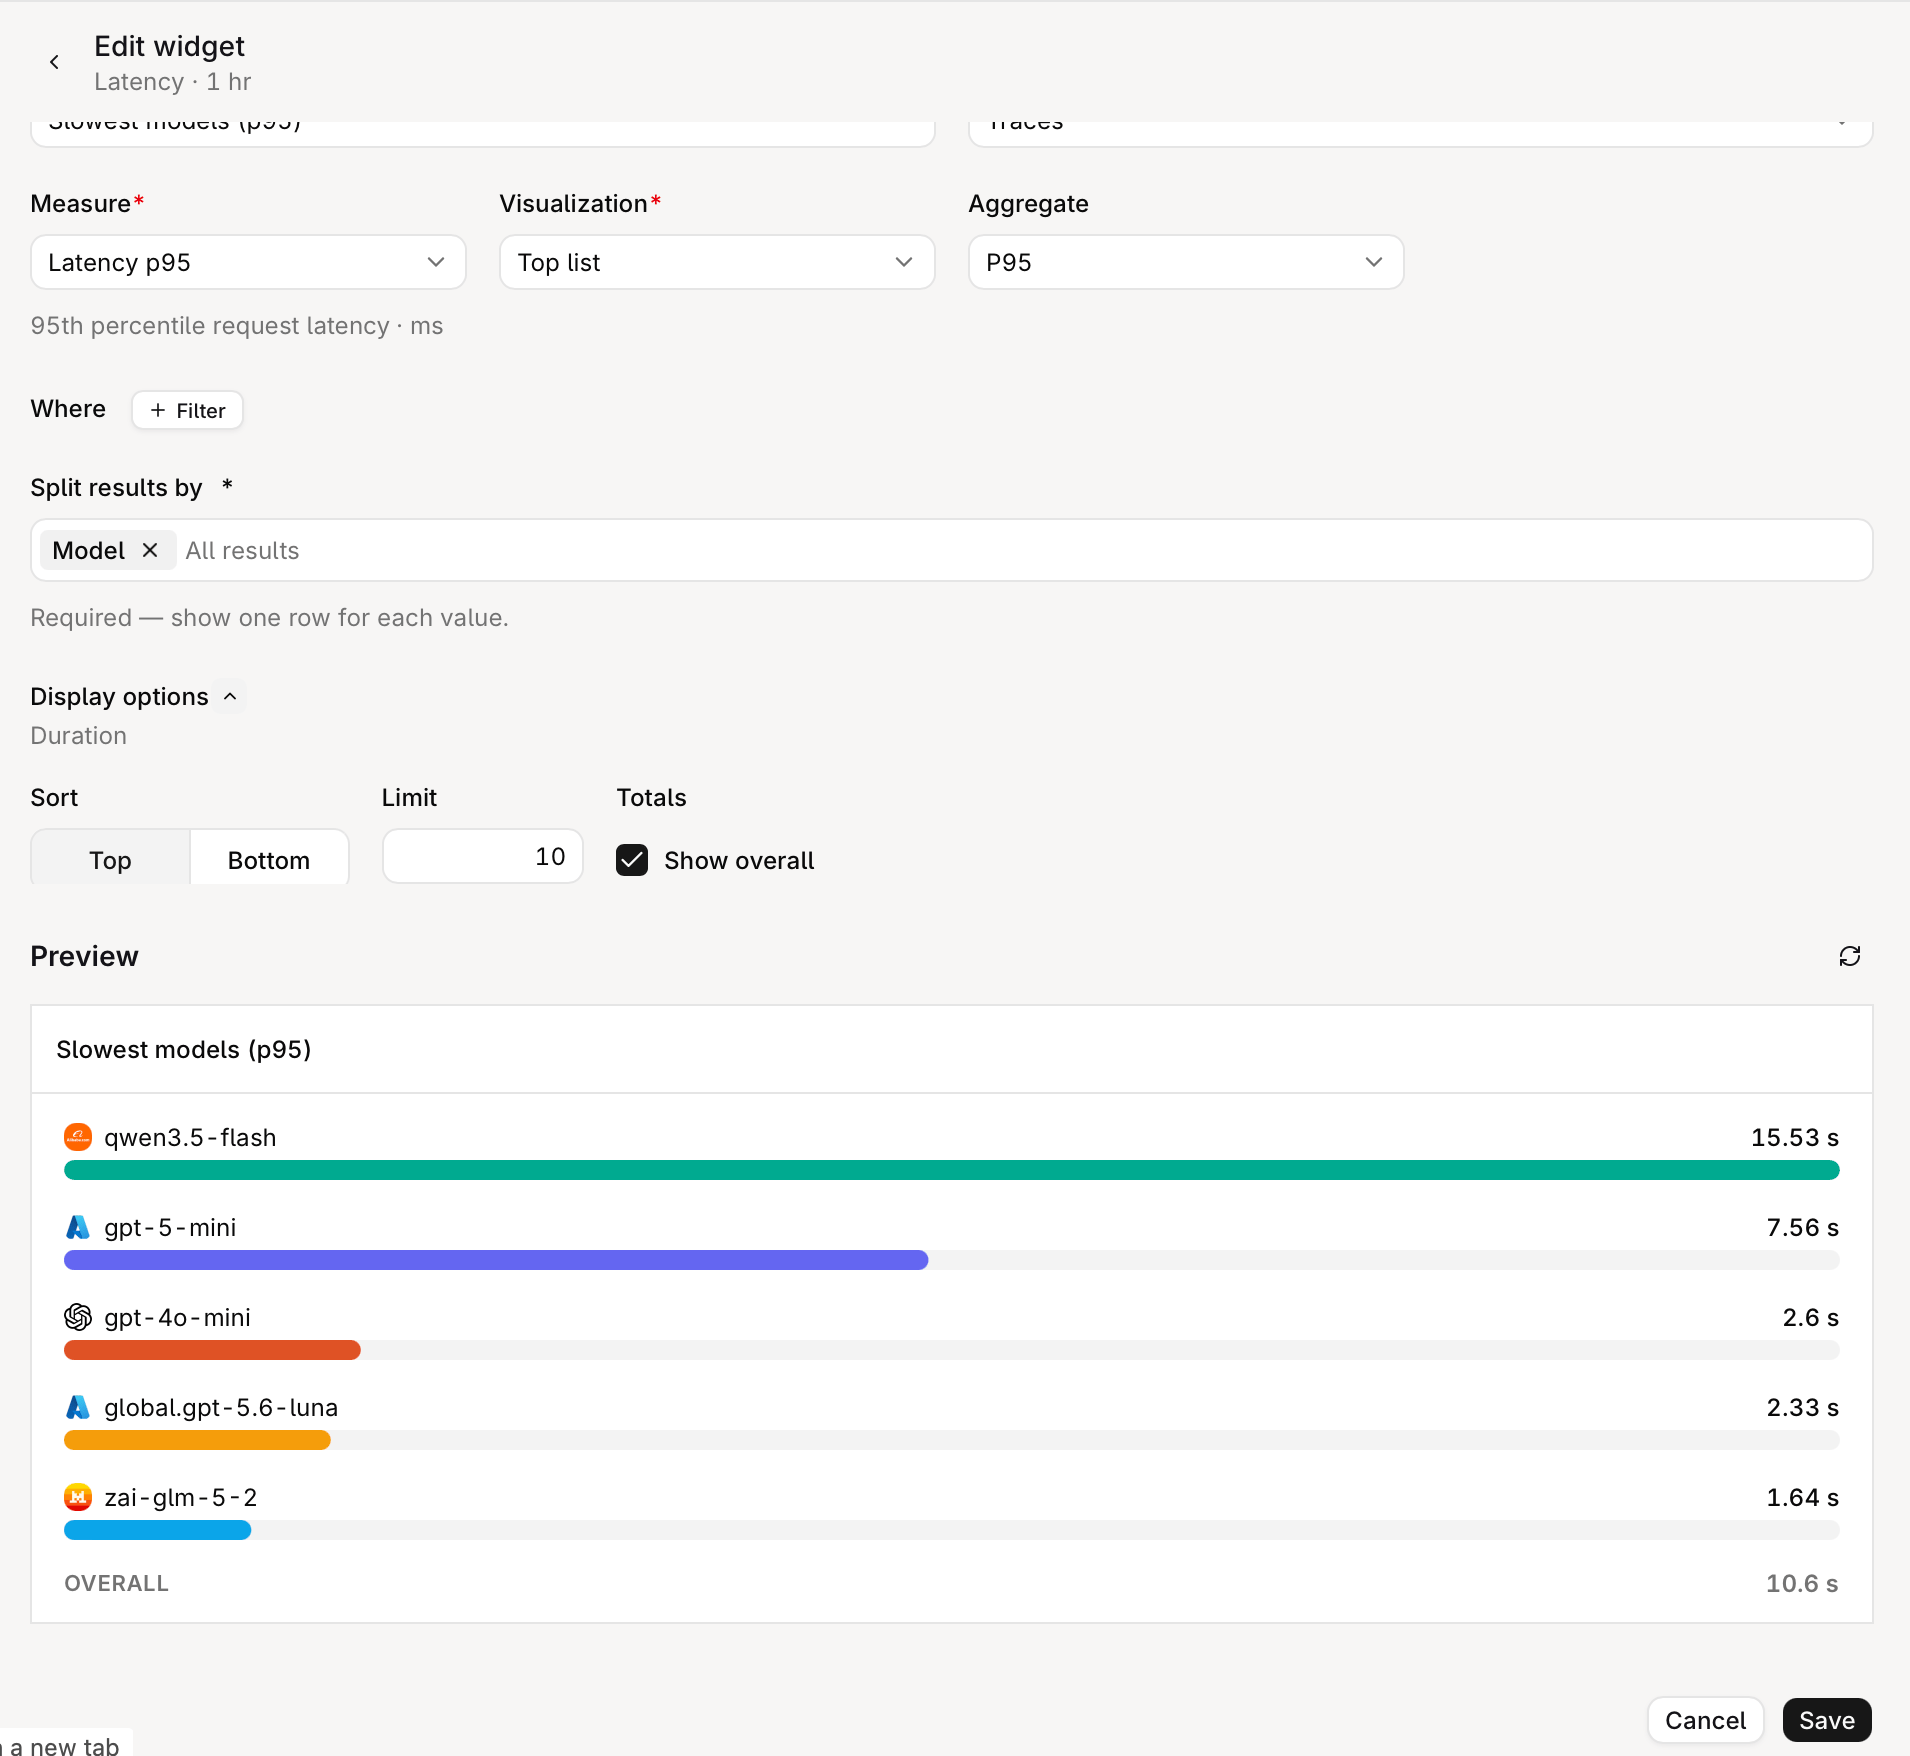
Editing a top list widget. The preview updates as the configuration changes.
1
Choose the data
- Dataset: Traces, Metrics, or Logs. Only the datasets available to the workspace are listed.
- Measure: the metric to chart, for example
Requests,LLM cost,Latency p95, orEvaluator pass rate. See Measures. - Aggregate: how values are combined, such as count, sum, average, or a percentile. The options depend on the measure.
- Interval: the bucket size for time series, Auto, Minute, Hour, or Day.
2
Filter the data
Under Where, choose + Filter to restrict the query, for example to one model, provider, or Deployment. Up to 20 filters per widget.
3
Split the results
Under Split results by, select one or more dimensions, such as Model, Provider, Project, Agent, or Tool, to get one series or row per value. Leave it empty to chart all results together.
4
Name and visualize
Enter a Title, then pick a Visualization. Only visualizations that fit the query are listed:
5
Adjust display options
Expand Display options to fine tune the widget. Which options appear depends on the visualization:
- Sort and Limit: show the Top or Bottom values, and how many (top lists and tables).
- Value precision: decimal places, from 0 to 6. Leave blank for automatic.
- Show overall, Show others, Show percentage: add a total row, group remaining values into one row, or show each value’s share (top lists and tables).
- Target line: a reference value drawn on the chart (time series).
6
Save
Check the Preview, then choose Save. The widget is added to the Monitor.
Measures
The Traces dataset provides the GenAI measures below.Managing Monitors
- AI Studio
- API & SDK
The Monitors list shows each Monitor with its scope, widget count, last update, and who updated it.
- Search by name or description, and Filter by Scope.
- Open the menu on a row to open, Duplicate, or Delete a Monitor. A duplicate copies every widget.
- To rename a Monitor, change its description, or change its default range, open it and choose Settings from the menu.