

/home in the workspace URL.
The time range picker and the refresh control sit in the page header and apply to every tab. The range defaults to the last 14 days and is written to the page URL, so a copied link opens the same window.
Overview
The default view: four KPI tiles over the selected range, followed by the charts that explain them.
Below the tiles, Usage by model, Request volume by model, Token breakdown, Usage type, and Prompt caching each chart one cut of the same window. Every card carries an Explore link that opens that chart in the Explore tab.
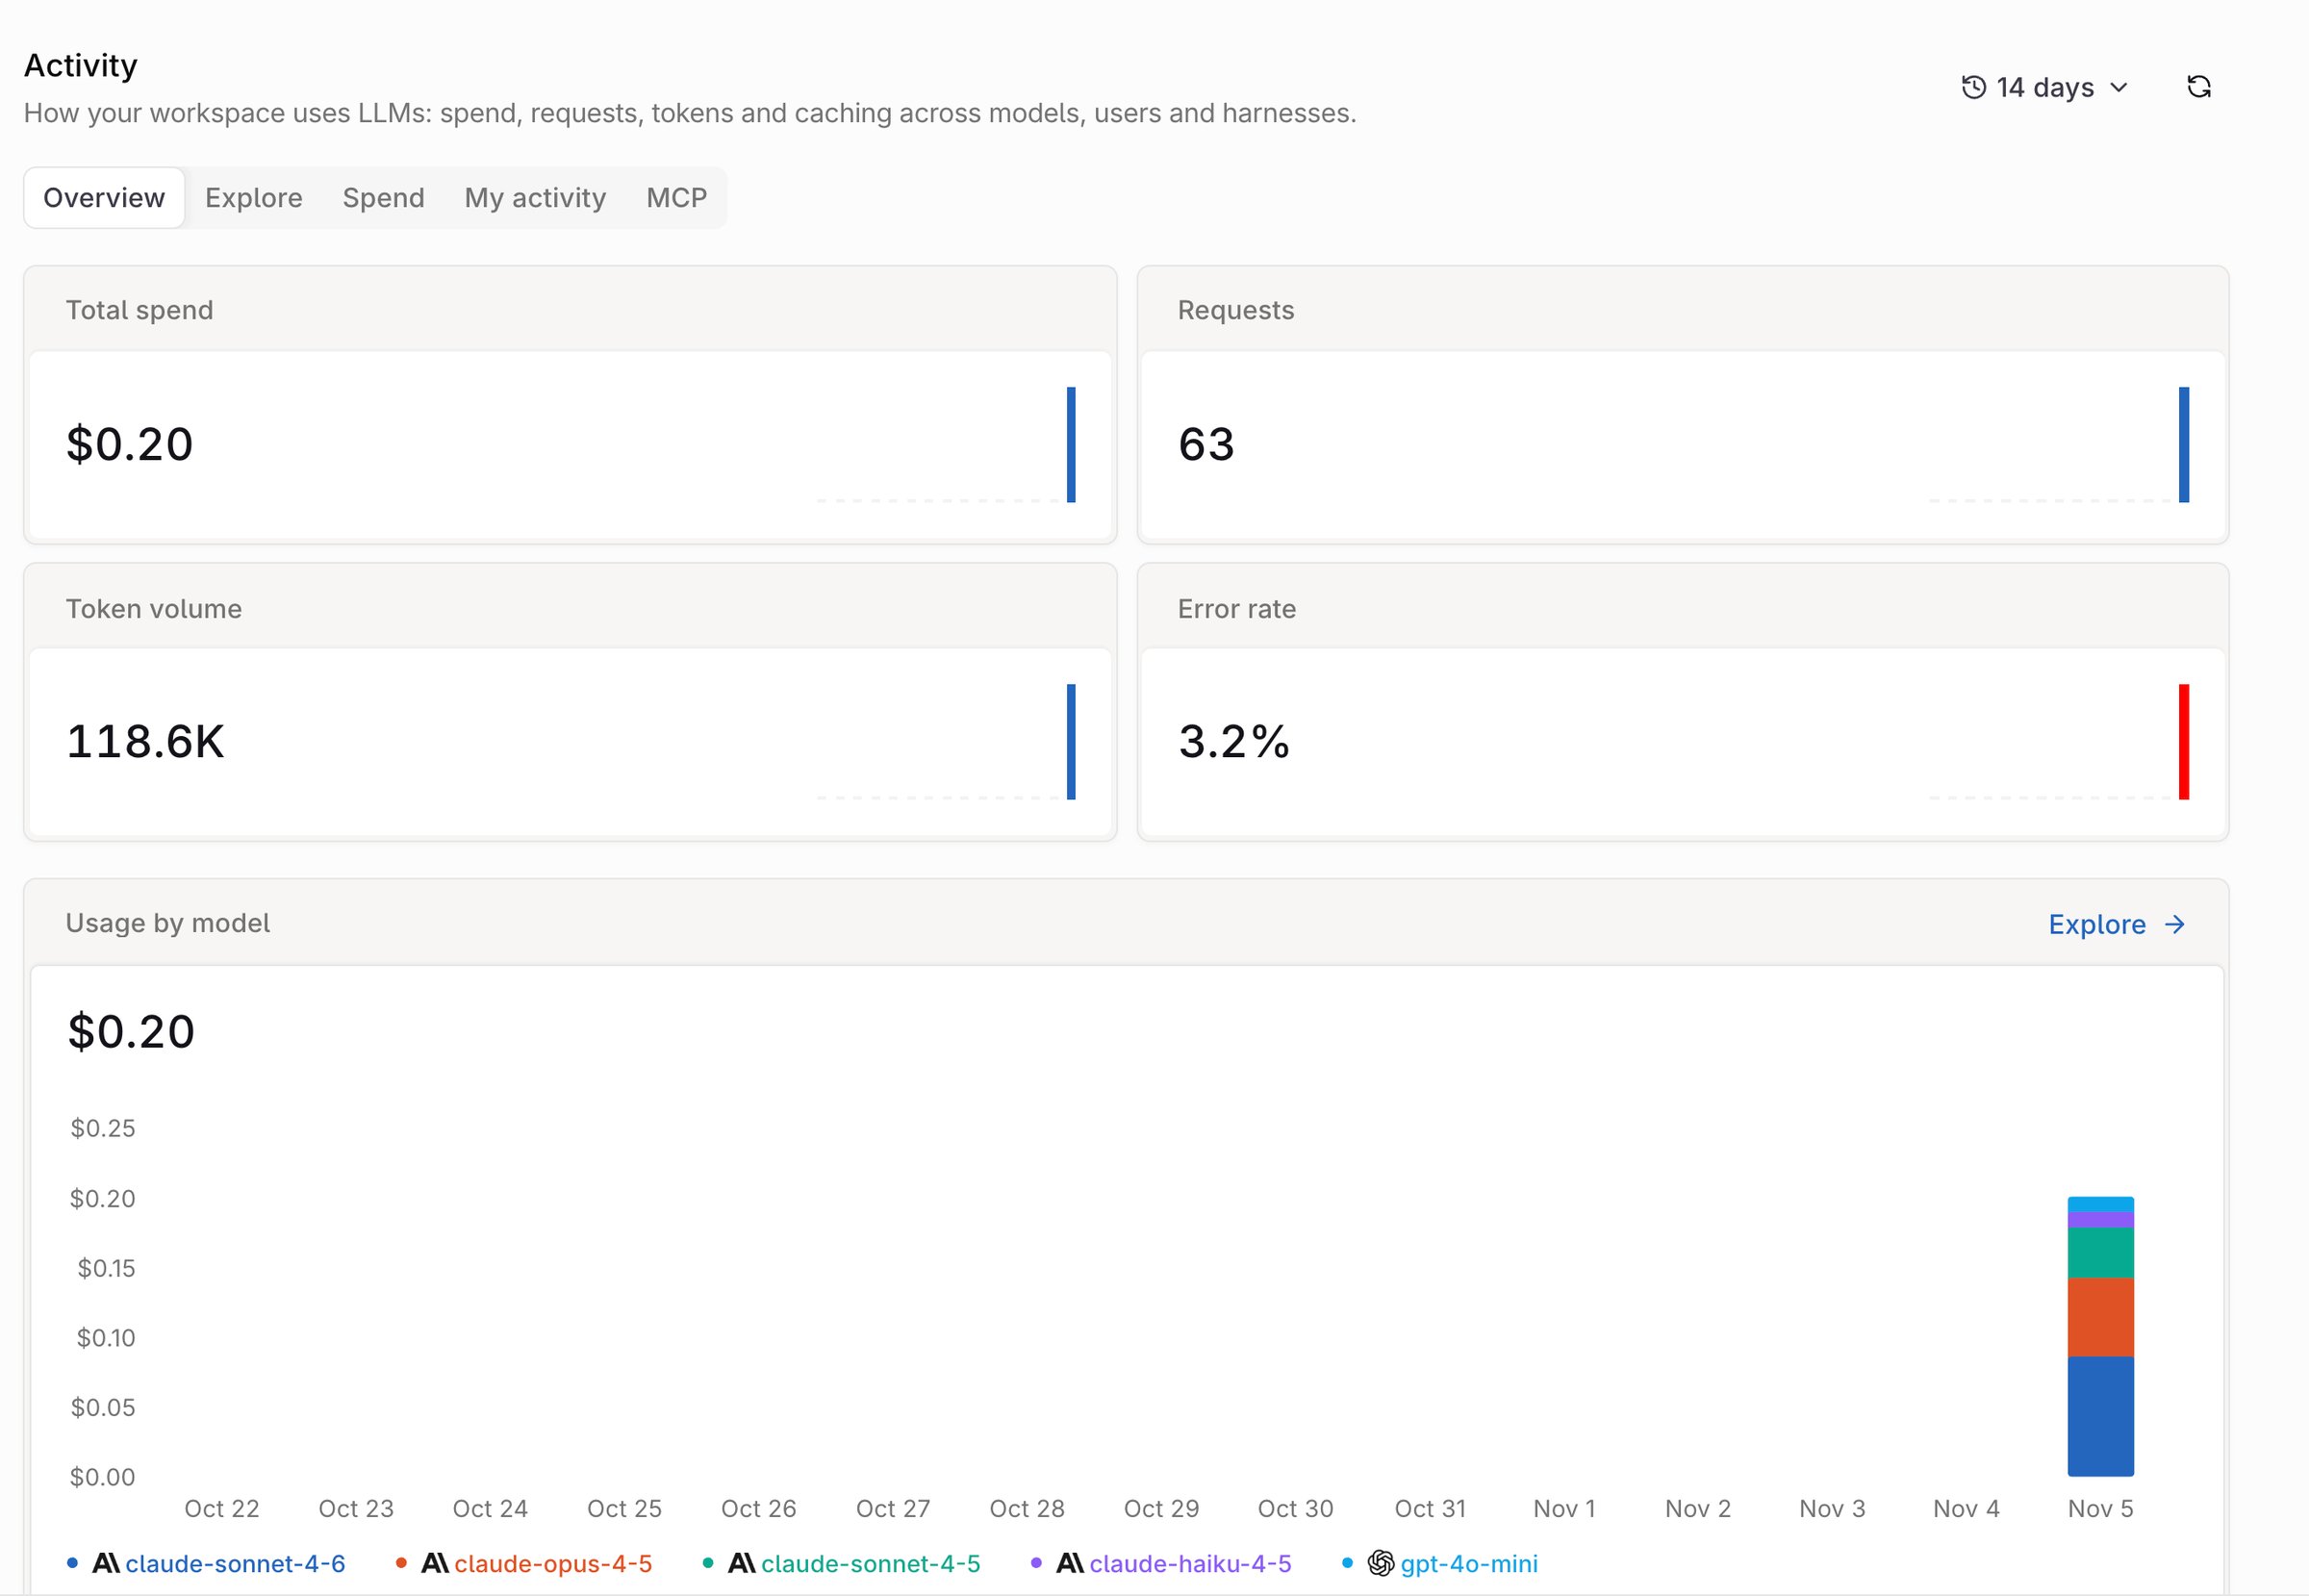
The Overview tab: KPI tiles over charts for the selected range.
Explore
Build a chart from the metrics and dimensions in the query builder, then read the numbers behind it.- Query builder: pick a metric (Cost (total), requests, tokens, error rate, and the rest), a by dimension, and an optional subgroup. Add opens the Top N ranking and Rollup controls; Clear all resets the builder.
- Chart: switch between Lines and Stacked bars, or Donut and Breakdown when the Rollup is total, expand to full width, or select Save to Monitors to keep the chart as a Monitor widget.
- Share of card: the same metric as a share of the total, which sums to 100%.
- Ranked table: one row per value of the split, with requests, cost, average cost per request, in and out tokens per request, and total tokens.
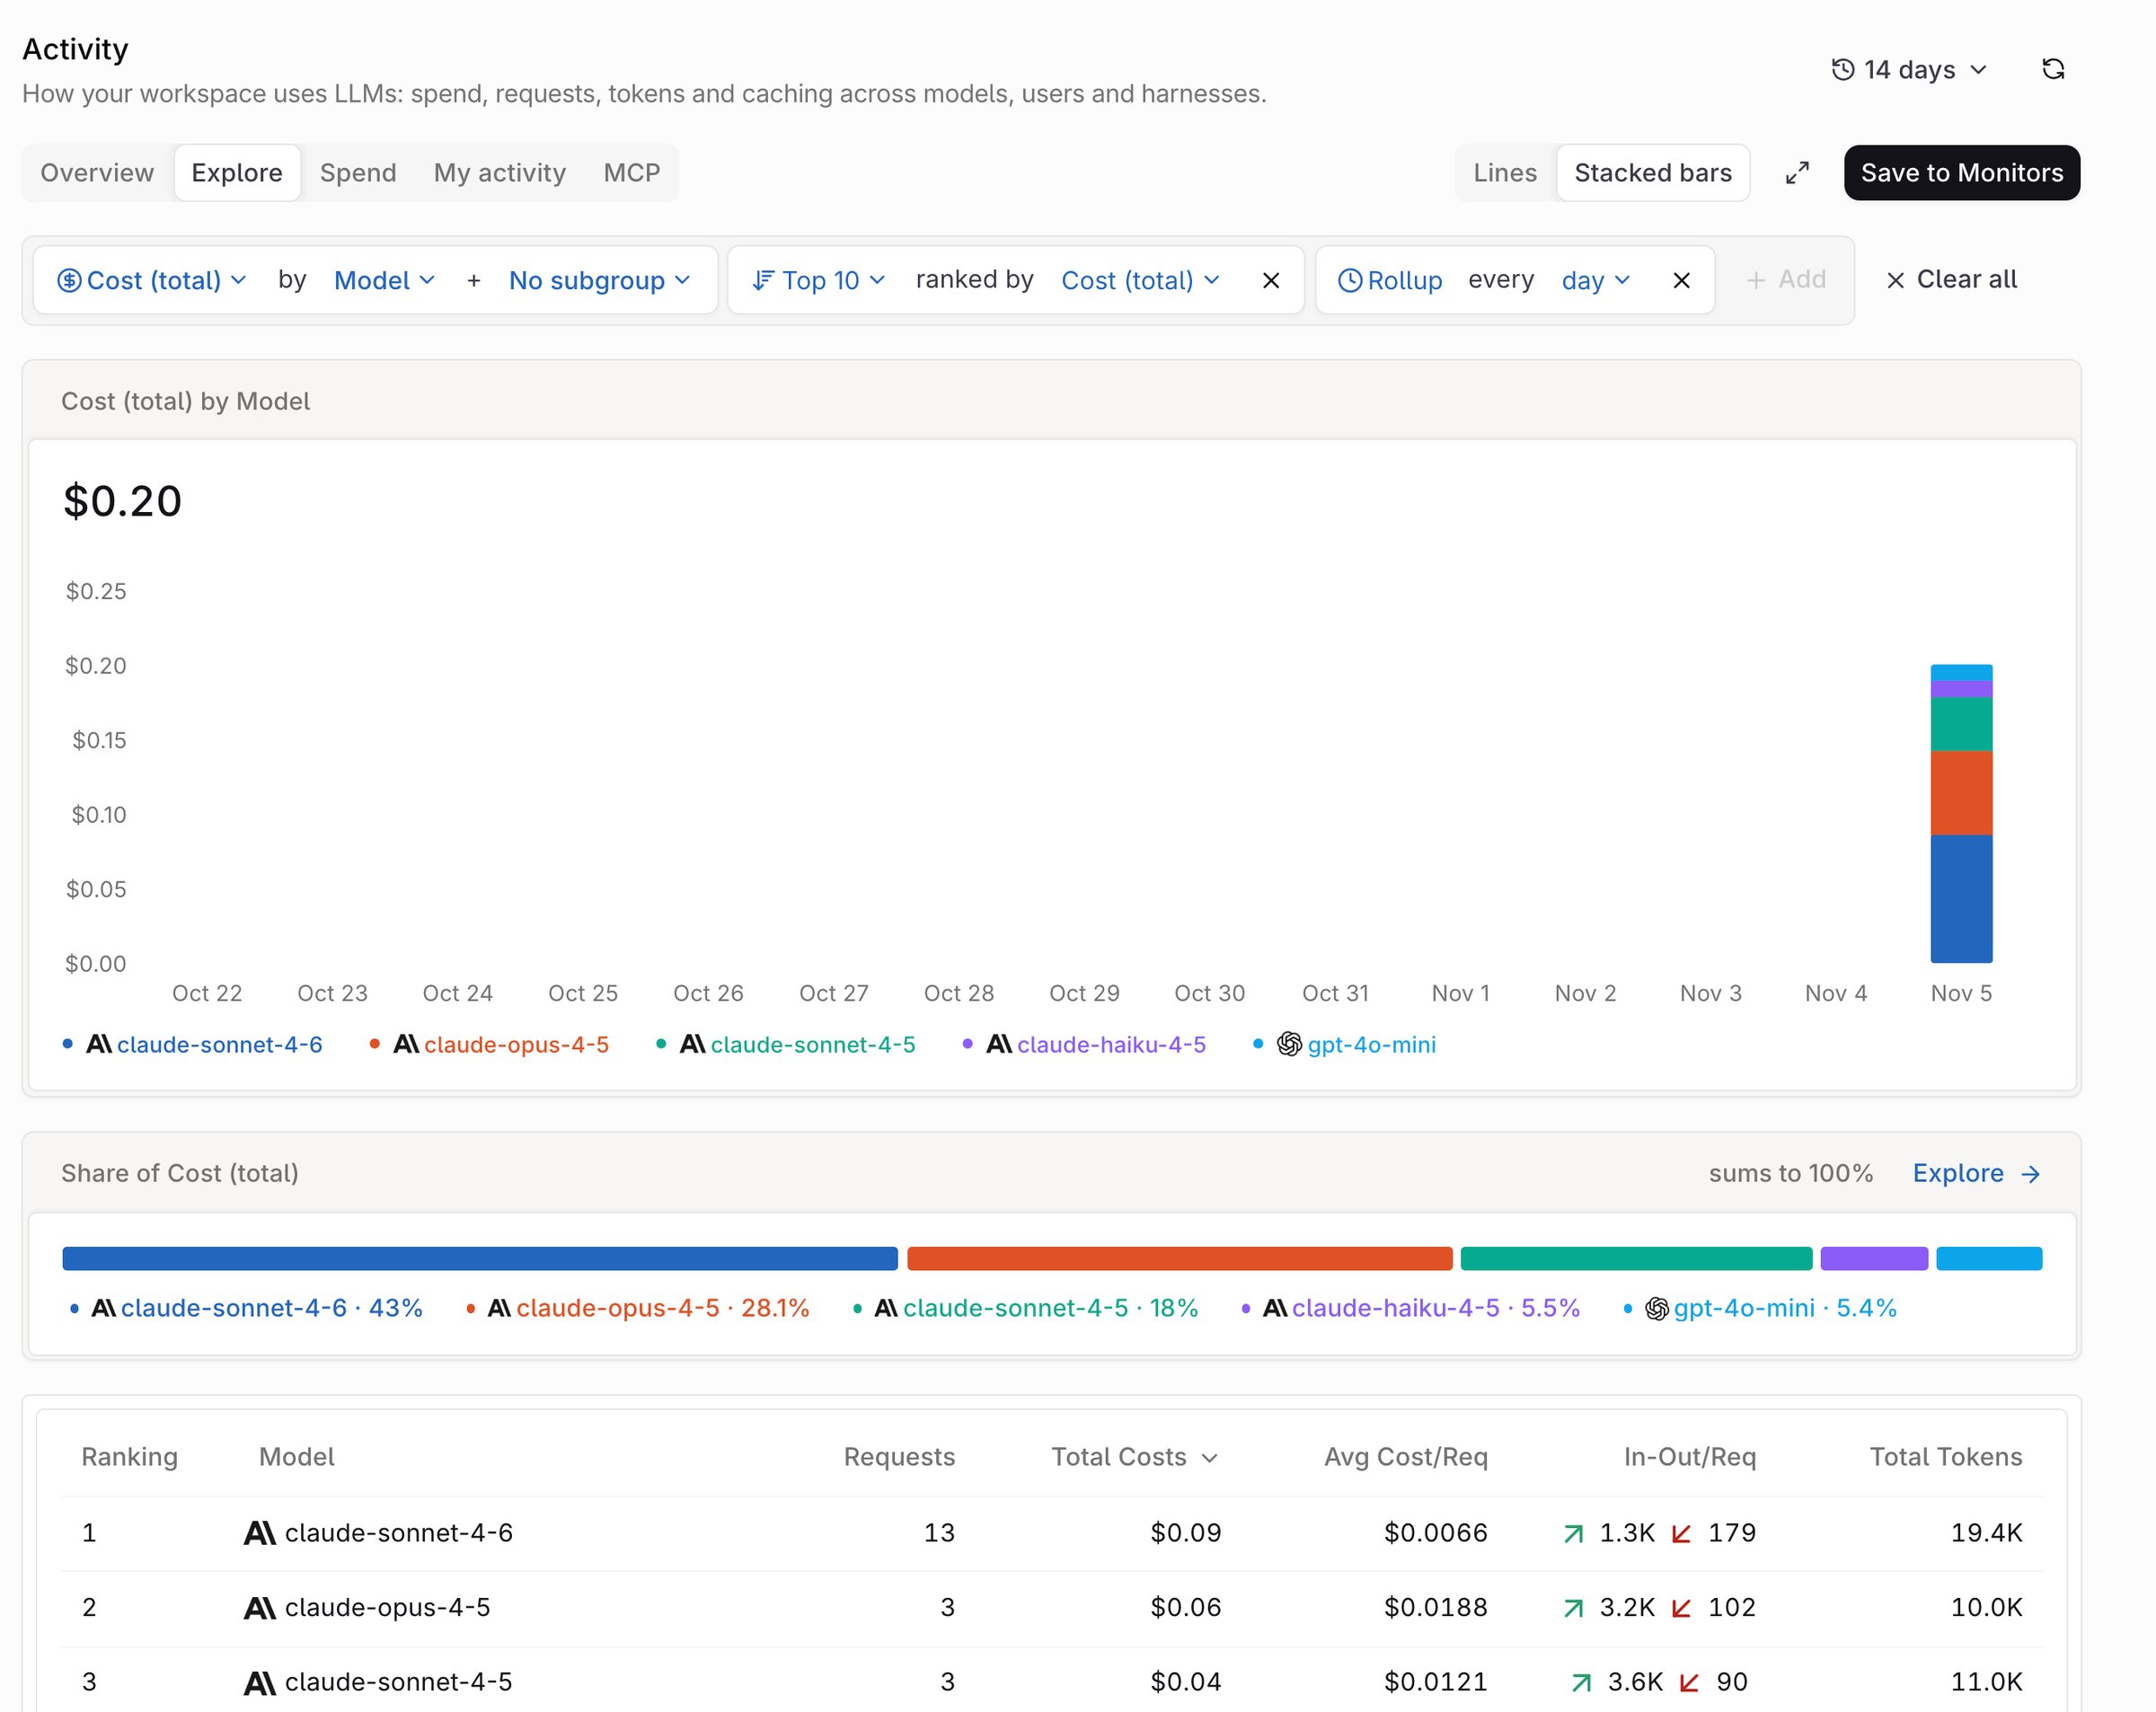
The Explore tab: the query builder above a chart, share card, and ranked table.
Spend
Break spend down by dimension, then read the trend.- Breakdown dimensions: Projects, Providers, Models, API keys, Identities, or Harnesses, each with share, spend, and tokens per row.
- Spend by <dimension>: a donut of the same split.
- Spend over time: the same window as a line or bar chart.
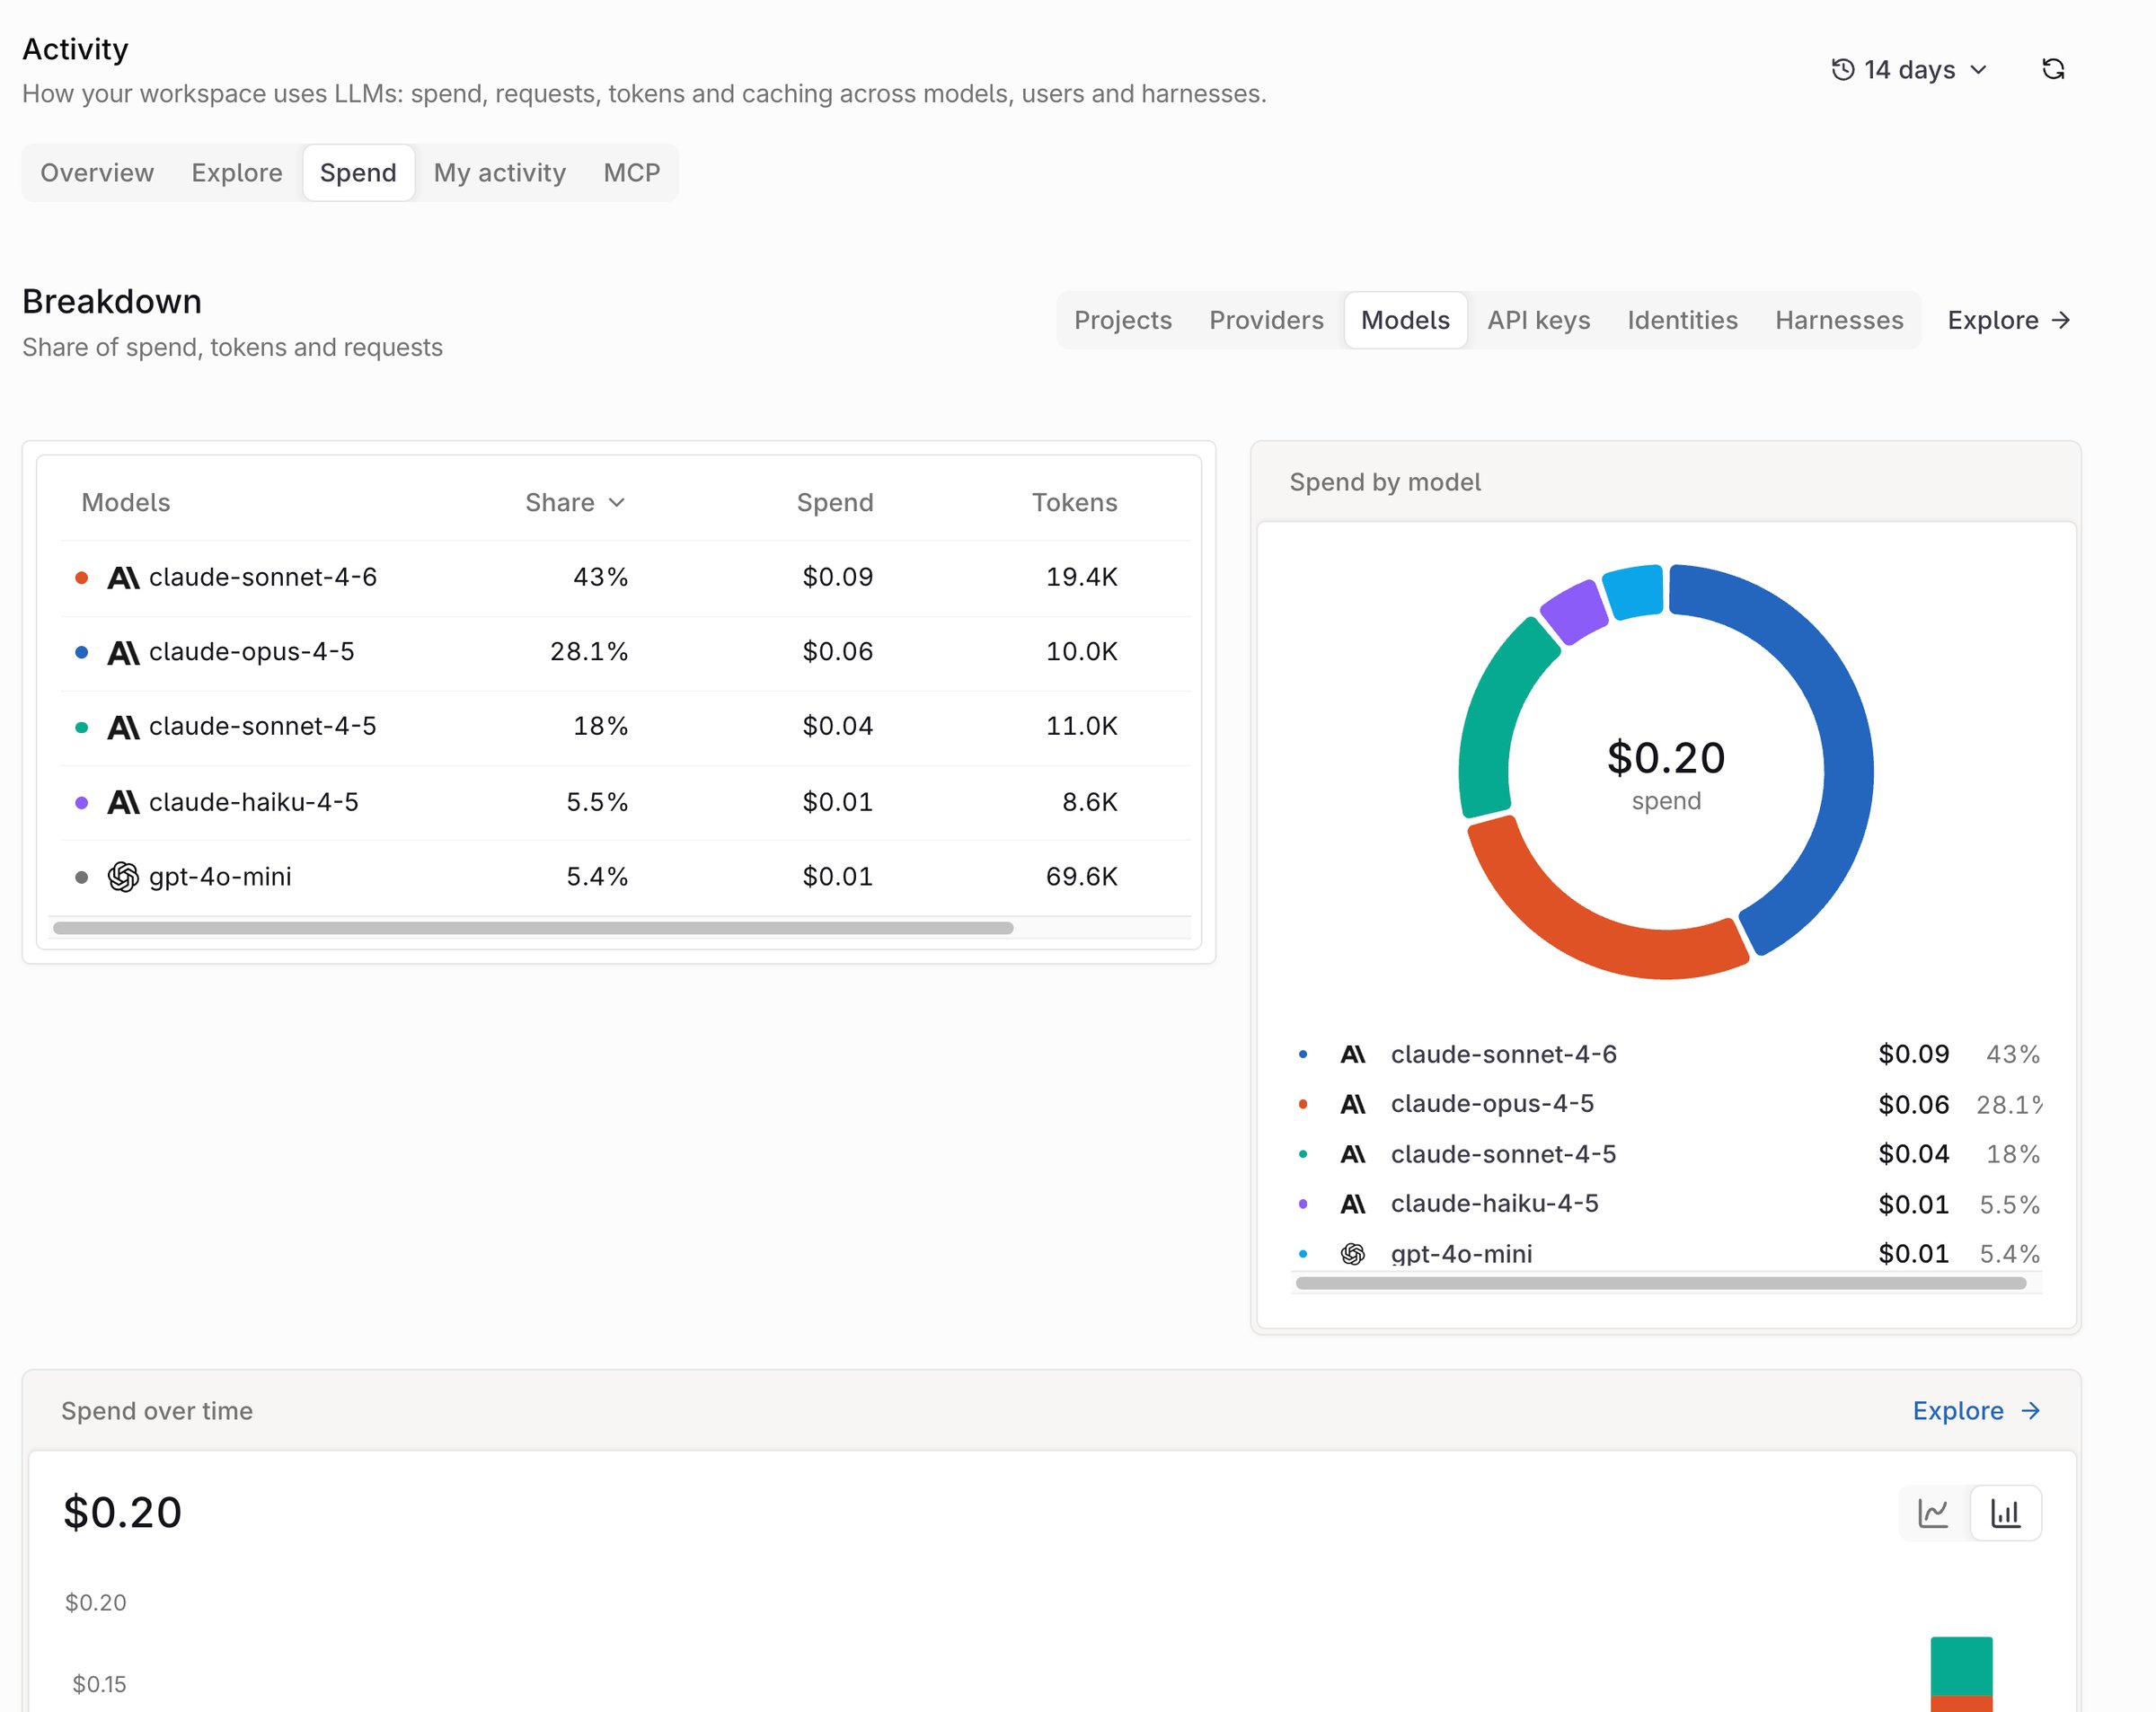
The Spend tab: a model breakdown, a donut, and spend over time.