

Running AI workloads means navigating a patchwork of provider endpoints, data residency requirements, and GDPR considerations. The AI Router gives you a single, EU-hosted gateway to route traffic across models and providers while keeping data where it needs to stay.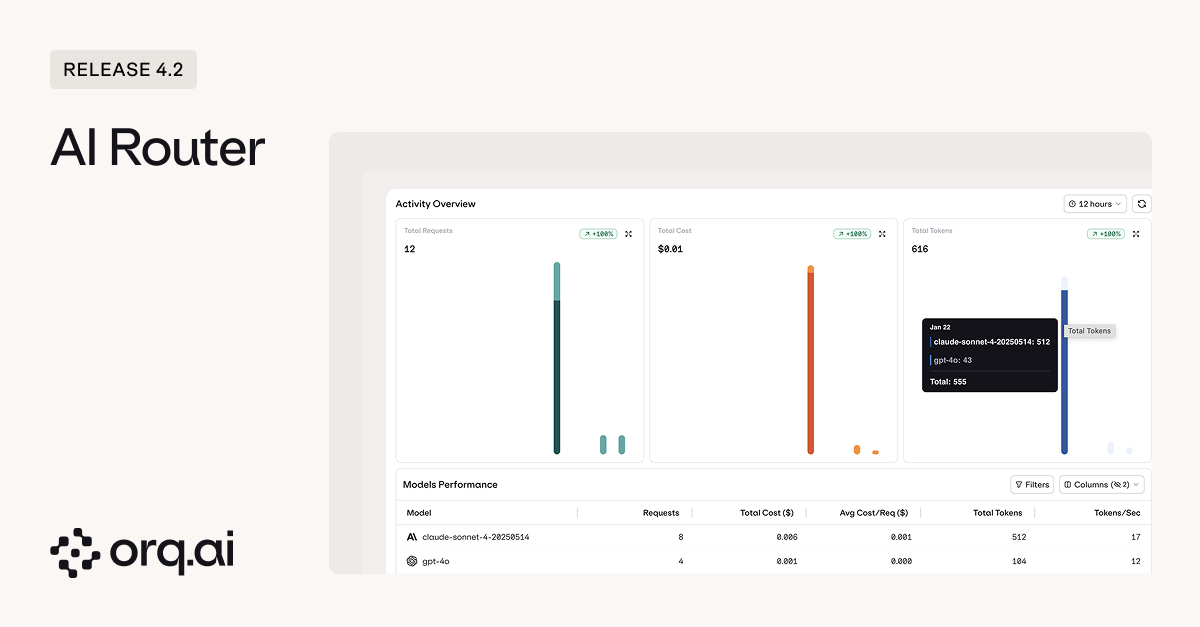
- EU data residency — route AI traffic through European infrastructure, simplifying GDPR compliance without sacrificing model choice.
- One key, 300+ models — a single Router API key gives developers access to 20+ model providers without managing separate credentials for each.
- Centralized key management — create Router API keys scoped by project, environment, or use case.
- Credit limits — set spend caps per key to prevent runaway costs before they happen.
- Key expiration — issue time-limited keys to external clients or contractors that automatically expire, so you never have to remember to revoke them.
- Air-gapped VPC deployment — deploy the AI Router within your own virtual private cloud for complete network isolation and control.
- Dedicated Traces view — see every request routed through the AI Router in one place, no manual filtering across projects required.
- Usage and spend dashboard — track tokens, latency, and costs across teams and applications from a single view.
Learn how to configure the AI Router and manage API keys in the AI Router Documentation.
When something changes in production, you need to know who did it and when. Audit Logs give you a complete record of every action across your organization: API key creation, deployment changes, team member modifications, dataset updates, all in one place.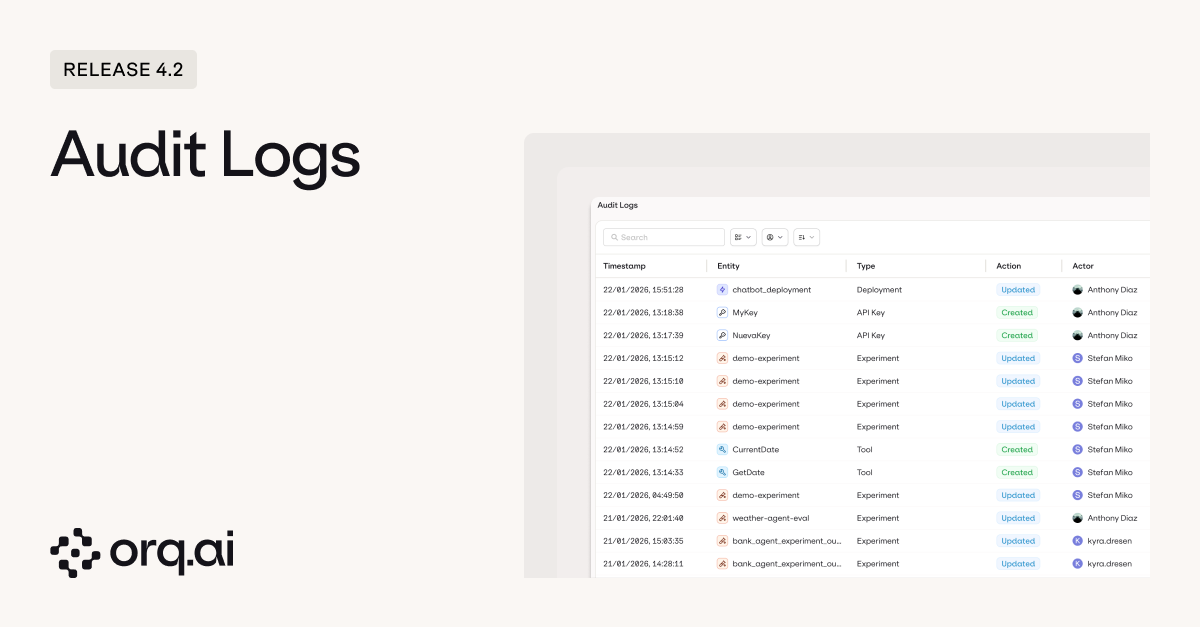
- Every action, timestamped including Created, Updated, Deleted, and Revoked events across all entity types such as API Keys, Agents, Experiments, and Team Members.
- Full actor attribution so you always know who made the change, not just what changed.
- Filterable by entity type and actor to quickly narrow down exactly what you’re looking for.
- Configurable retention with custom TTL settings based on your compliance requirements.
Access Audit Logs from Organization > Audit Logs. Learn more in the Audit Logs Documentation.
Debugging agents used to mean diving into the global Traces view and manually filtering down to the agent you care about. Now every agent has its own dedicated trace view, showing all executions for that agent with the full breakdown of what happened and why.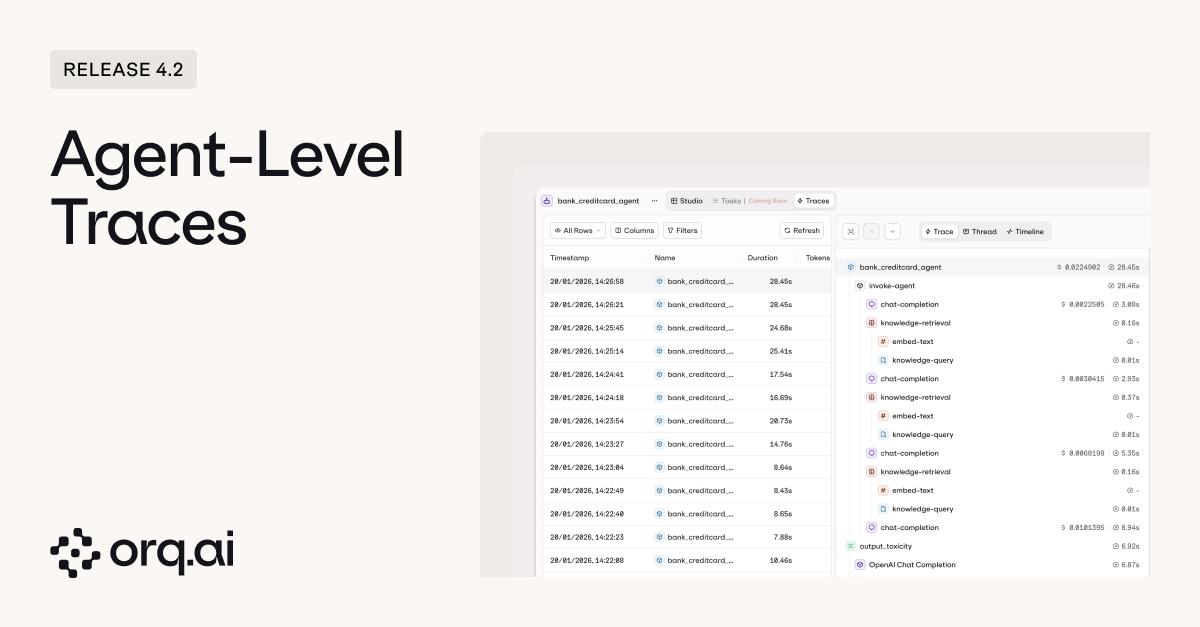
- Traces scoped to the agent so you see every execution for that specific agent without manual filtering. Apply additional filters from there to narrow down further.
- Full execution visibility showing each step in the agent’s reasoning, every tool call with its parameters, and the results of each tool execution.
- Saved views to create reusable filter presets for yourself (private) or share them across the project for consistent team-wide debugging workflows.
Learn more about agent debugging in the Agents Documentation.
Until now, experiments were designed around prompts and model variants. But if you’re building agents, you need the same rigor: controlled comparisons, consistent datasets, and structured evaluation. Now you can run agents directly in experiments alongside prompt variants.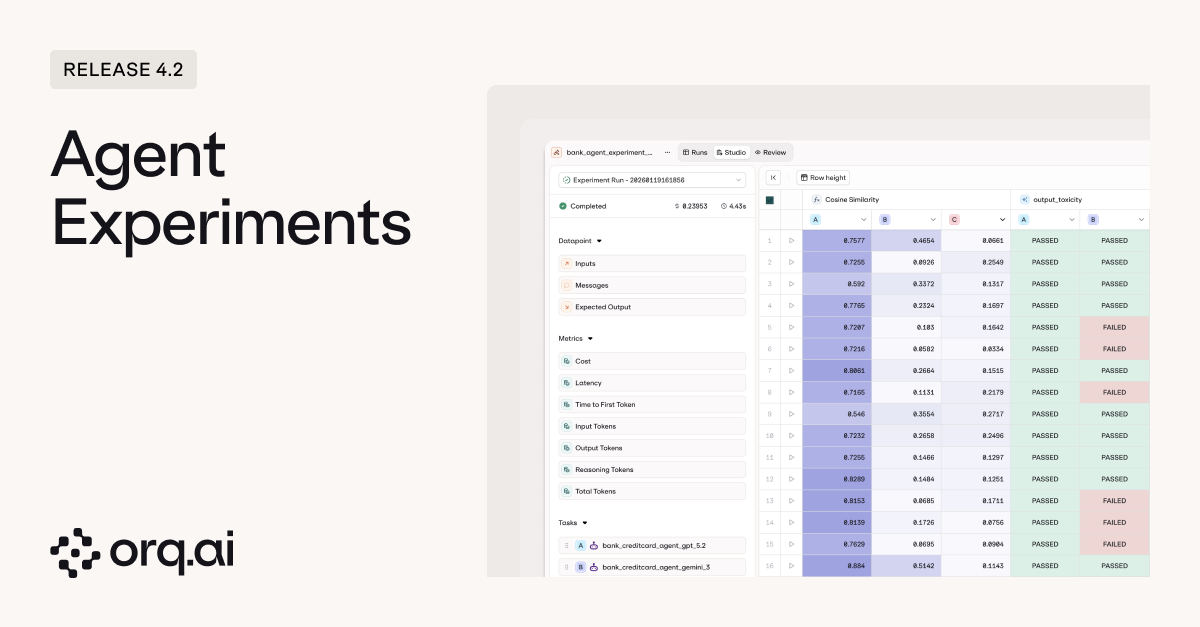
- Run agents in experiments to test agent performance against the same datasets and evaluators you use for prompts.
- Swap agents during setup to quickly benchmark different agent architectures or configurations against each other.
- Test agents with different tool sets to see how tool availability affects agent behavior and outcomes.
- Compare multi-agent setups to evaluate different orchestration patterns and agent combinations.
- Run the same agent on different models to find the right cost/performance tradeoff without changing anything else.
- Full execution visibility in review mode showing the complete agent run including every step, tool call, and tool response.
Learn how to run agent experiments in the Experiments Documentation.
Automated evaluators catch a lot, but sometimes you need a human to look at the output and say “this isn’t right.” Experiments now have a dedicated review screen where you can leave structured human feedback on individual results, with full visibility into what happened during execution.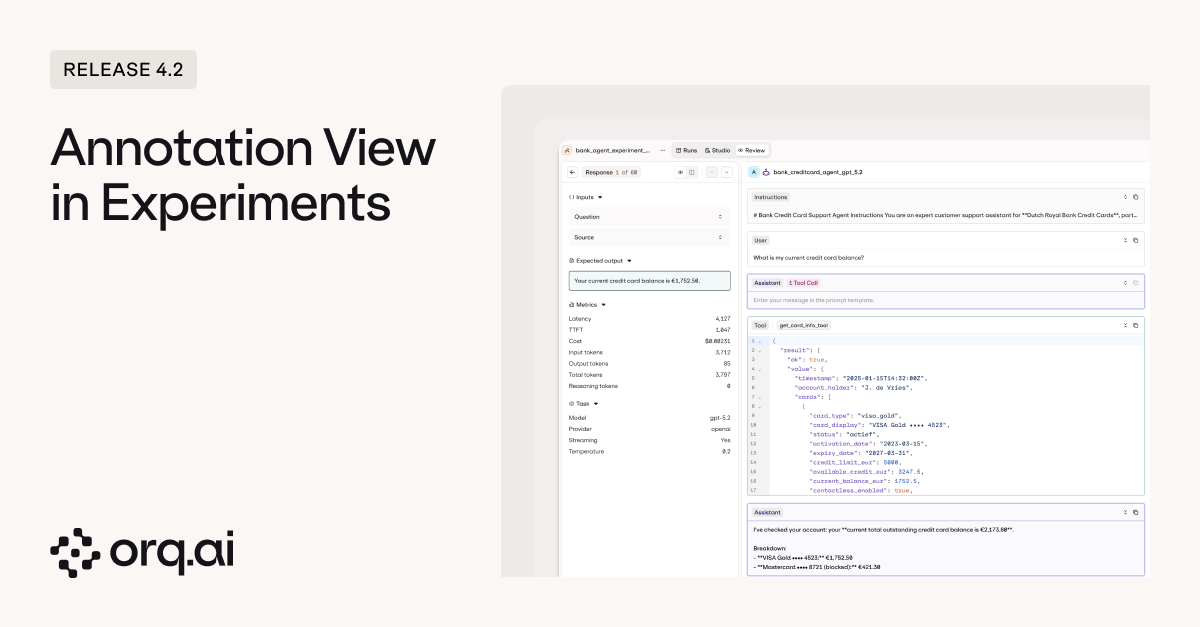
- Human review on experiment results to annotate individual transactions directly from the review screen, whether you’re evaluating prompt outputs or full agent executions.
- Full execution context while reviewing so annotators see everything: the input, the output, and for agents, every step and tool call that led to the result.
- All metrics at a glance including latency, time to first token, token consumption, temperature settings, and other configuration details.
- Read-only visibility in the overview so human feedback is preserved and visible to the full team without risk of accidental edits.
Learn more about human review workflows in the Experiments Documentation.
A round of quality-of-life updates to make experiments faster to navigate and easier to iterate on.What’s New:
- Redesigned experiment UI for clearer navigation and results at a glance.
- Granular token tracking showing input, output, reasoning, and total tokens per run.
- Dataset search to find the right dataset faster when setting up experiments.
- Custom names when duplicating so cloned experiments are easier to identify.
- Logs moved to Review mode for a simplified experiment view.
Learn more in the Experiments Documentation.
We’ve updated the Deployment UI to align with the Agents experience, bringing a consistent layout and navigation patterns across both.
Learn more in the Deployments Documentation.
The Chunking API now delivers up to 8x faster document processing. Optimized for typical document sizes like 20-page PDFs, so knowledge base ingestion and RAG pipelines spend less time waiting.
Learn more in the Chunking API Documentation.
We’ve updated naming across the platform for clarity:
- Admin → Organization — same capabilities, new name. Your central hub for workspace configuration, team management, API keys, billing, environments, webhooks, and human review workflows.
- Contacts → Identities — tie AI metrics to specific users, teams, projects, or clients across your organization. Create an Identity via the API or Studio, attach it to API calls, and get usage analytics grouped by that entity. You can also set budget limits per Identity to control spending at the user or department level. New in this release: pass an Identity directly on the deployment invoke request instead of setting it on the client.
contact to identity in your code.- cURL
- Python
- TypeScript
See the updated Organization Documentation and Identities Documentation.
We’ve added GLM 4.7 from Z.ai to the AI Router. This 355B parameter Mixture-of-Experts model (32B active parameters) brings a 38% improvement over GLM 4.6 on HLE benchmarks, with comprehensive upgrades to general conversation, reasoning, and agent capabilities.Model Specs:
- 200K context window with 128K maximum output tokens
- Enhanced agentic coding capabilities for complex multi-step development tasks
- Tool calling, JSON mode, and streaming supported
- $0.60 per 1M input tokens
- $2.20 per 1M output tokens
Explore GLM 4.7 in the AI Router or via Supported Models.