

Debugging AI systems means constantly context-switching between your code editor, experiment results, trace logs, and analytics dashboards. The Orq MCP server brings your entire Orq workspace into Claude Desktop, Claude Code, Cursor, or any MCP-compatible client with 23 tools for managing agents, datasets, running experiments, querying traces, and analyzing performance without leaving your development environment.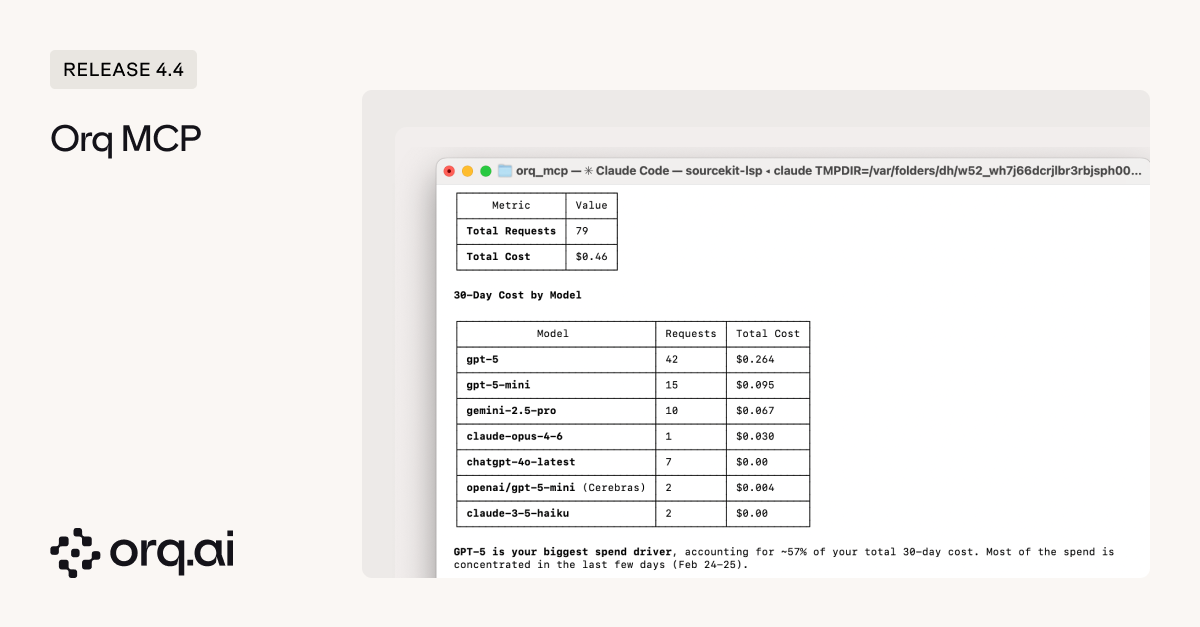
- Create and configure agents from conversation — define new agents with custom instructions, tools, models, evaluators, and guardrails, retrieve existing agent configurations, and test agents in experiments to compare performance across different setups.
- Run full experiments from conversation — create datasets with test cases, configure experiment runs with different models, prompts, or agents, execute them, and pull results (JSON/JSONL/CSV) to analyze which configuration performs better, all without opening the Orq UI.
- Trace any OpenTelemetry-compatible application — query traces with filters to surface errors, inspect individual spans to debug failed agent runs, ask questions like “which traces are throwing 500 errors?” or “list all queries that resulted in no knowledge base retrievals” to identify gaps in your knowledge base coverage.
- Monitor cost and latency trends — pull workspace analytics to identify if your average cost per request is increasing, which models are driving spend, or whether latency degraded after recent changes.
- Create evaluators and guardrails on the fly — define LLM-as-a-Judge or Python evaluators directly from your editor, attach them to agents or experiments when you spot failure patterns that need automated testing.
- Build synthetic datasets and manage test data in conversation — generate realistic test data, add datapoints to capture edge cases discovered during debugging, update expected outputs when requirements change, or create entirely new datasets without switching tools.
- Agents (2) —
get_agent,create_agent - Analytics (2) —
get_analytics_overview,query_analytics - Datasets (6) —
create_dataset,list_datapoints,create_datapoints,update_datapoint,delete_datapoints,delete_dataset - Evaluators (2) —
create_llm_eval,create_python_eval - Experiments (3) —
list_experiment_runs,get_experiment_run,create_experiment - Models (1) —
list_models - Registry (2) —
list_registry_keys,list_registry_values - Search (2) —
search_entities,search_directories - Traces (3) —
list_traces,get_span,list_spans
- Claude Desktop — add Orq workspace as an MCP server in your Claude config
- Claude Code — connect from your terminal or IDE using the Claude Code CLI
- Cursor — configure MCP integration in Cursor settings
- Codex — AI coding assistant with MCP protocol support
Learn how to configure the Orq MCP server in the Code Assistants Setup Guide.
When you’re running agents from Orq.ai, OpenAI, LangGraph, or Vercel AI across your organization, understanding which ones are consuming resources, throwing errors, or sitting idle used to require manual trace filtering or custom analytics. Agent Control Tower gives you a unified monitoring dashboard for every AI asset in your workspace: agents, tools, deployments, and models.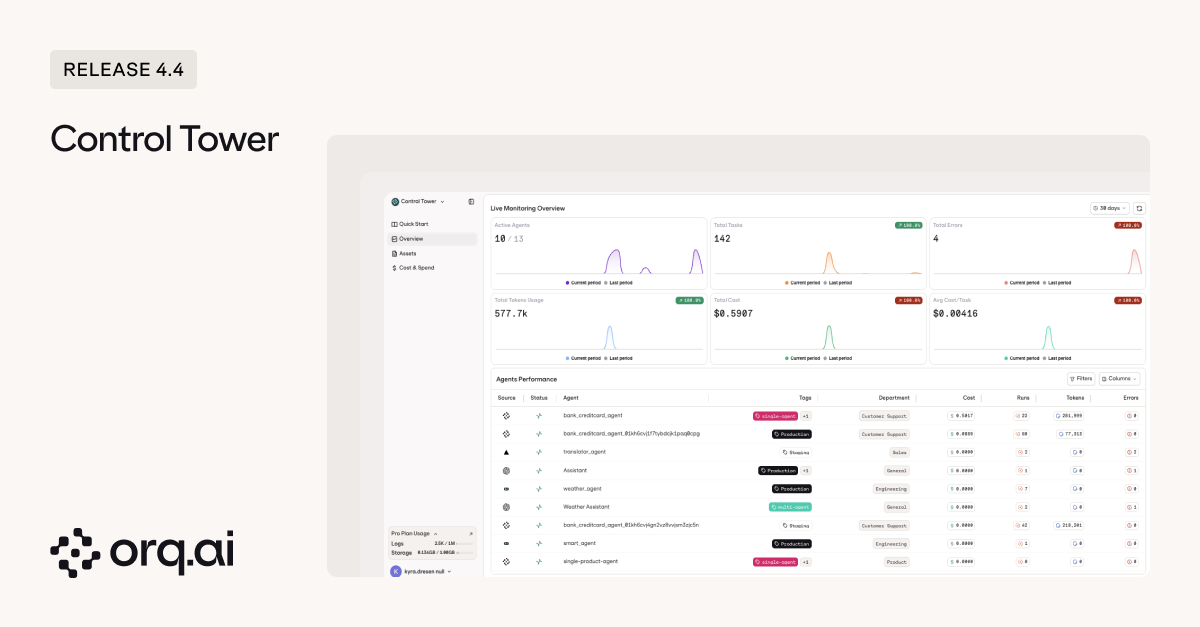
- Overview dashboard — workspace-wide metrics showing active agents, total tasks, errors, token usage, total cost, and average cost per task, with a performance table listing every agent and its metrics.
- Assets monitoring — four tabs for Agents, Tools, Deployments, and Models, each with summary cards, searchable tables, metrics-based sorting (cost, usage, errors, latency), and per-asset detail panels with trend charts.
- Tag and department filtering — organize assets by custom tags or departments, then filter analytics to see spend by team, project, or client.
- Status tracking — identify active, idle, and zombie assets (30+ days unused) to clean up unused resources.
- Trust levels — mark assets as Endorsed, Not Endorsed, or Deprecated to signal production readiness across your organization.
Learn how to navigate Agent Control Tower in the Agent Control Tower Documentation.
The Annotations API now supports any span in your traces, extending beyond its existing deployment feedback capabilities to improve monitoring and evaluation workflows across your entire AI stack.
- Feedback on agent spans — submit thumbs up/down, ratings, or custom feedback on agent execution traces, enabling real-time quality tracking for AI agents in production
- Programmatic feedback API — integrate feedback collection into production applications for real-time quality tracking across both deployment and agent workflows
- Unified annotation system across traces and logs — annotate any span including deployment spans, with annotations automatically synchronized between traces and logs for consistent monitoring across your entire observability stack; the Annotations API runs alongside the legacy Feedback API which will eventually be deprecated
Learn how to use the Annotations API in the Annotations API Documentation.