

Workspace Usage
Billing can be accessed inside Settings → Organization, where you have an overview of your usage over the current billing cycle. A graph displays the number of LLM, Retrievals, and Cache over time in your workspace. At the top-right of the graph, you can see your current usage against your plan capacity. When going beyond capacity, additional events are added to your billing cycle.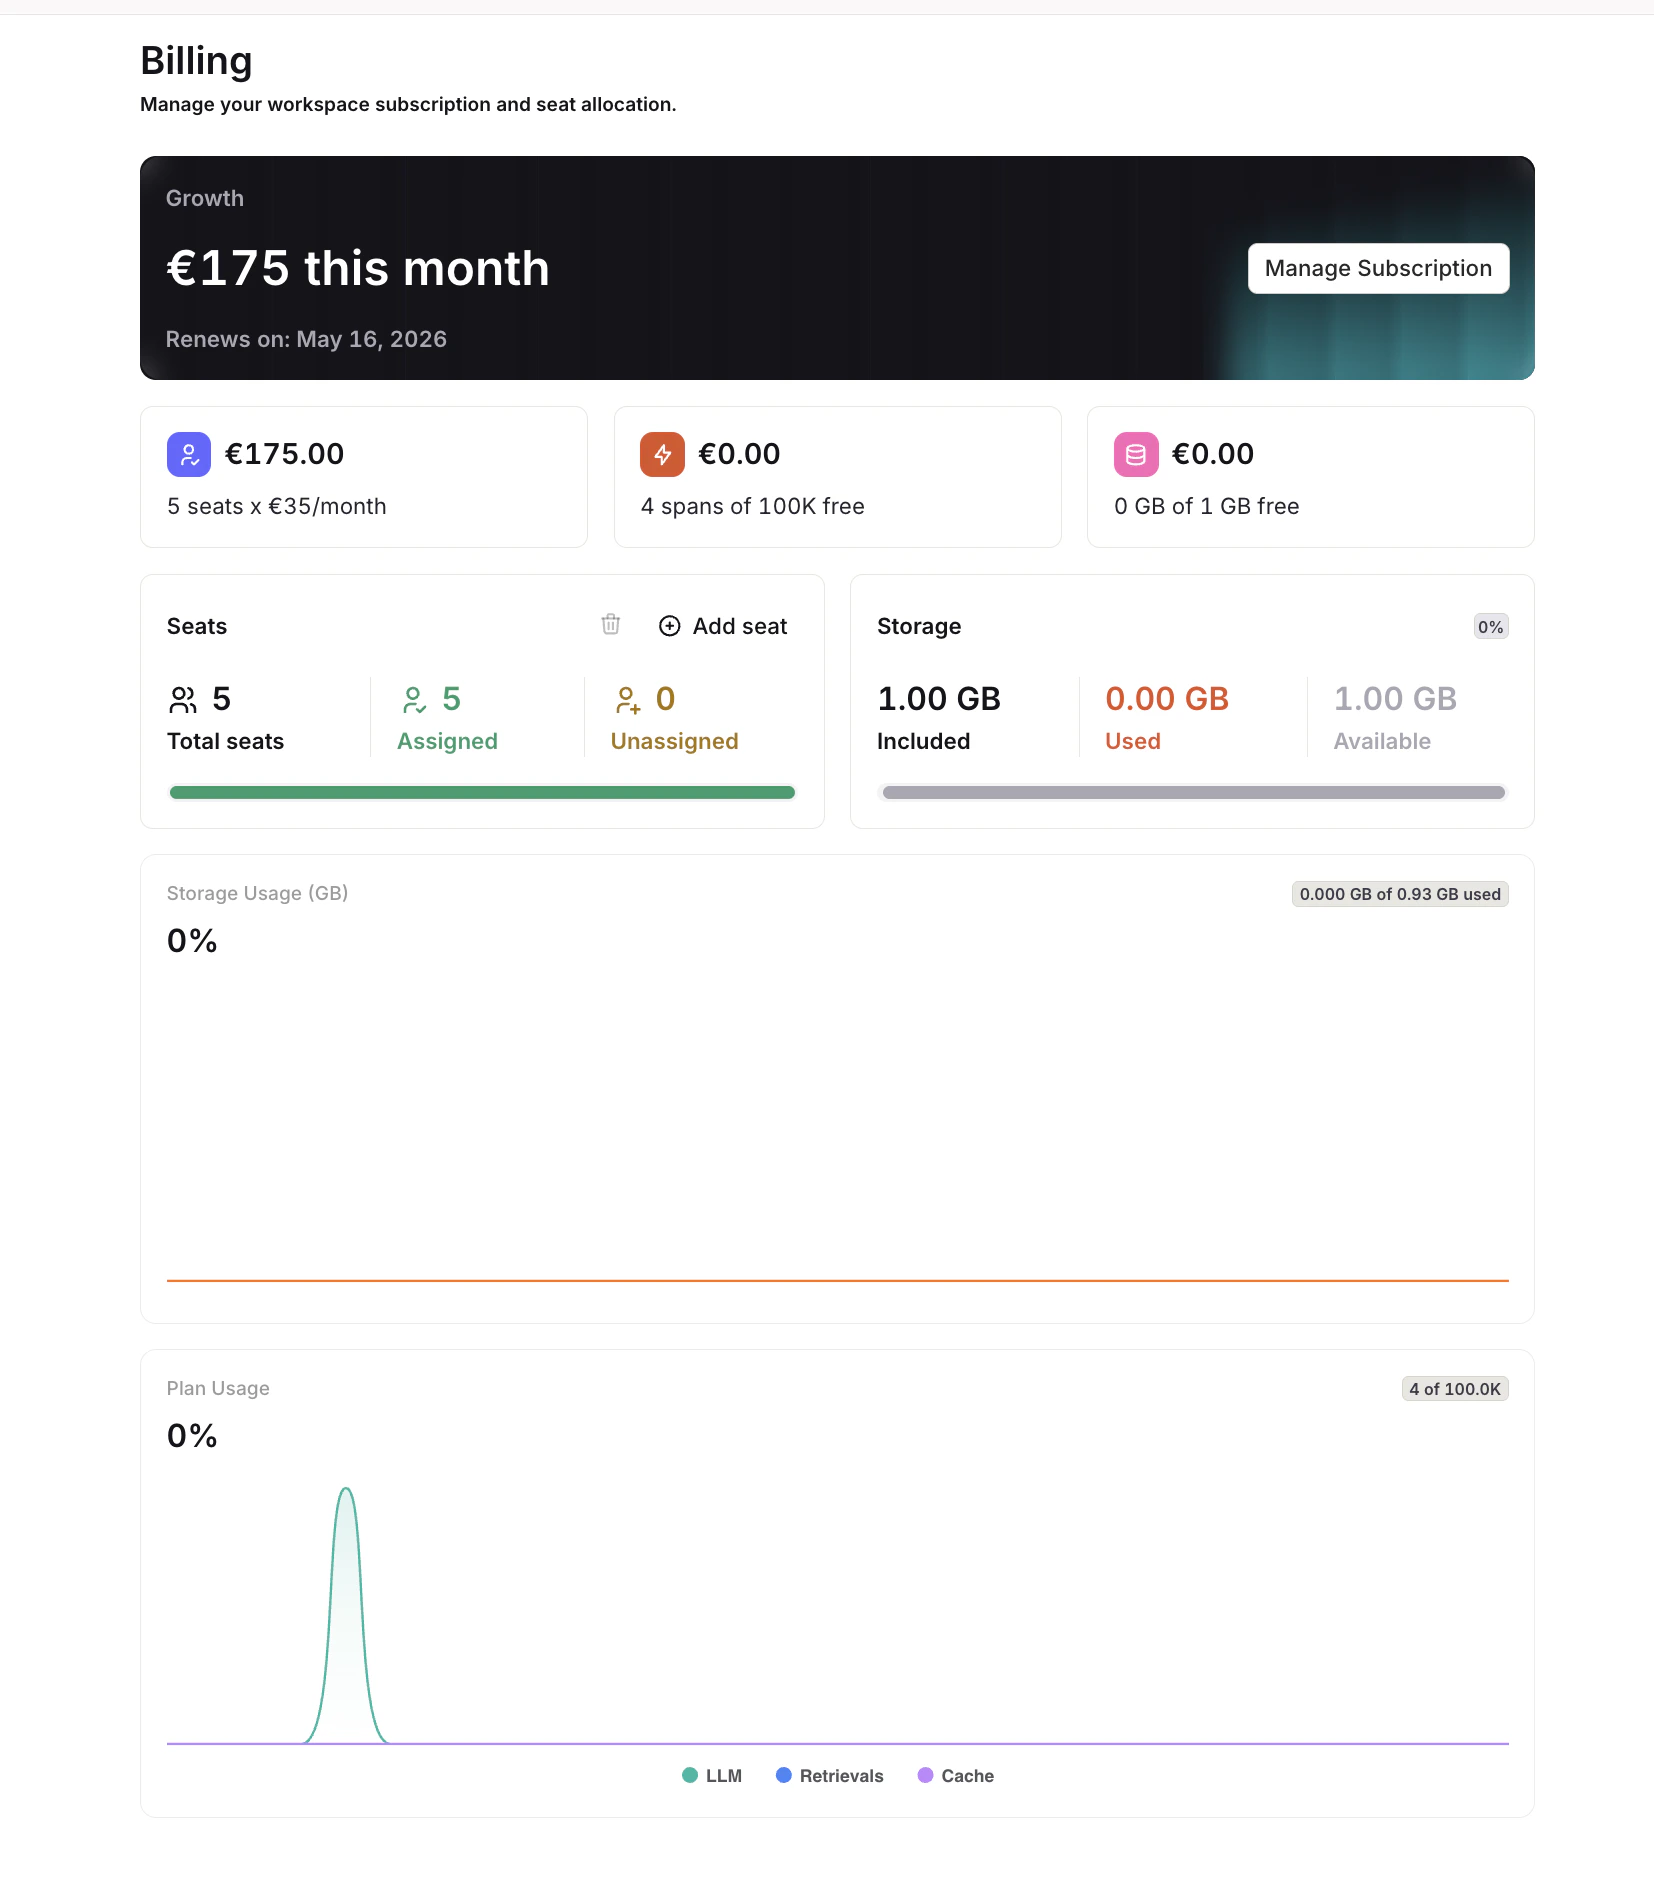
From the billing page, manage seats, see Storage Usage and Plan Usage, and review the current subscription.
View detailed usage breakdowns, trends, and event analytics in the Analytics dashboard.
Seats
On the Pay as you go plan, the number of members you can invite is controlled by your seat count. Seats are managed directly from the Settings → Organization → Billing page.Adding and Removing Seats
Use the Add seat button or the icon on the billing page to add or remove seats. Each seat corresponds to one workspace member slot. Seat changes are reflected immediately and will update your billing accordingly.You must have an available seat before inviting a new member. To learn how to invite members, see Members and Teams.
Understanding Trace Storage Usage
Storage usage measures telemetry ingested during a billing cycle. It includes traces from Orq.ai requests and OpenTelemetry exporters. Each trace contains one or more spans. The trace total is the sum of each span:total_tokens and are not added again.
While tracing is on:
orq.storage_size attribute on the span replaces either formula.
Workspace storage usage also includes ingested OpenTelemetry logs, metered separately using their recorded raw byte size.
Conversation history and repeated content
When a Responses API request usesprevious_response_id, Orq.ai reconstructs the conversation context before calling the model. That context is included in the model span’s input tokens, so a later step bills the tokens the model processed.
The same input can appear in more than one attribute on the model span and again on an Agent span. The meter uses the model span’s token total for that call. It does not bill each stored copy as extra tokens.
Understanding Events
A single Deployment invoke contains multiple events, each event will incur costs reflected in your Billing and Plan Usage. To understand better the events held within your Deployments, lookup Analytics and explore the events embedded into each generation.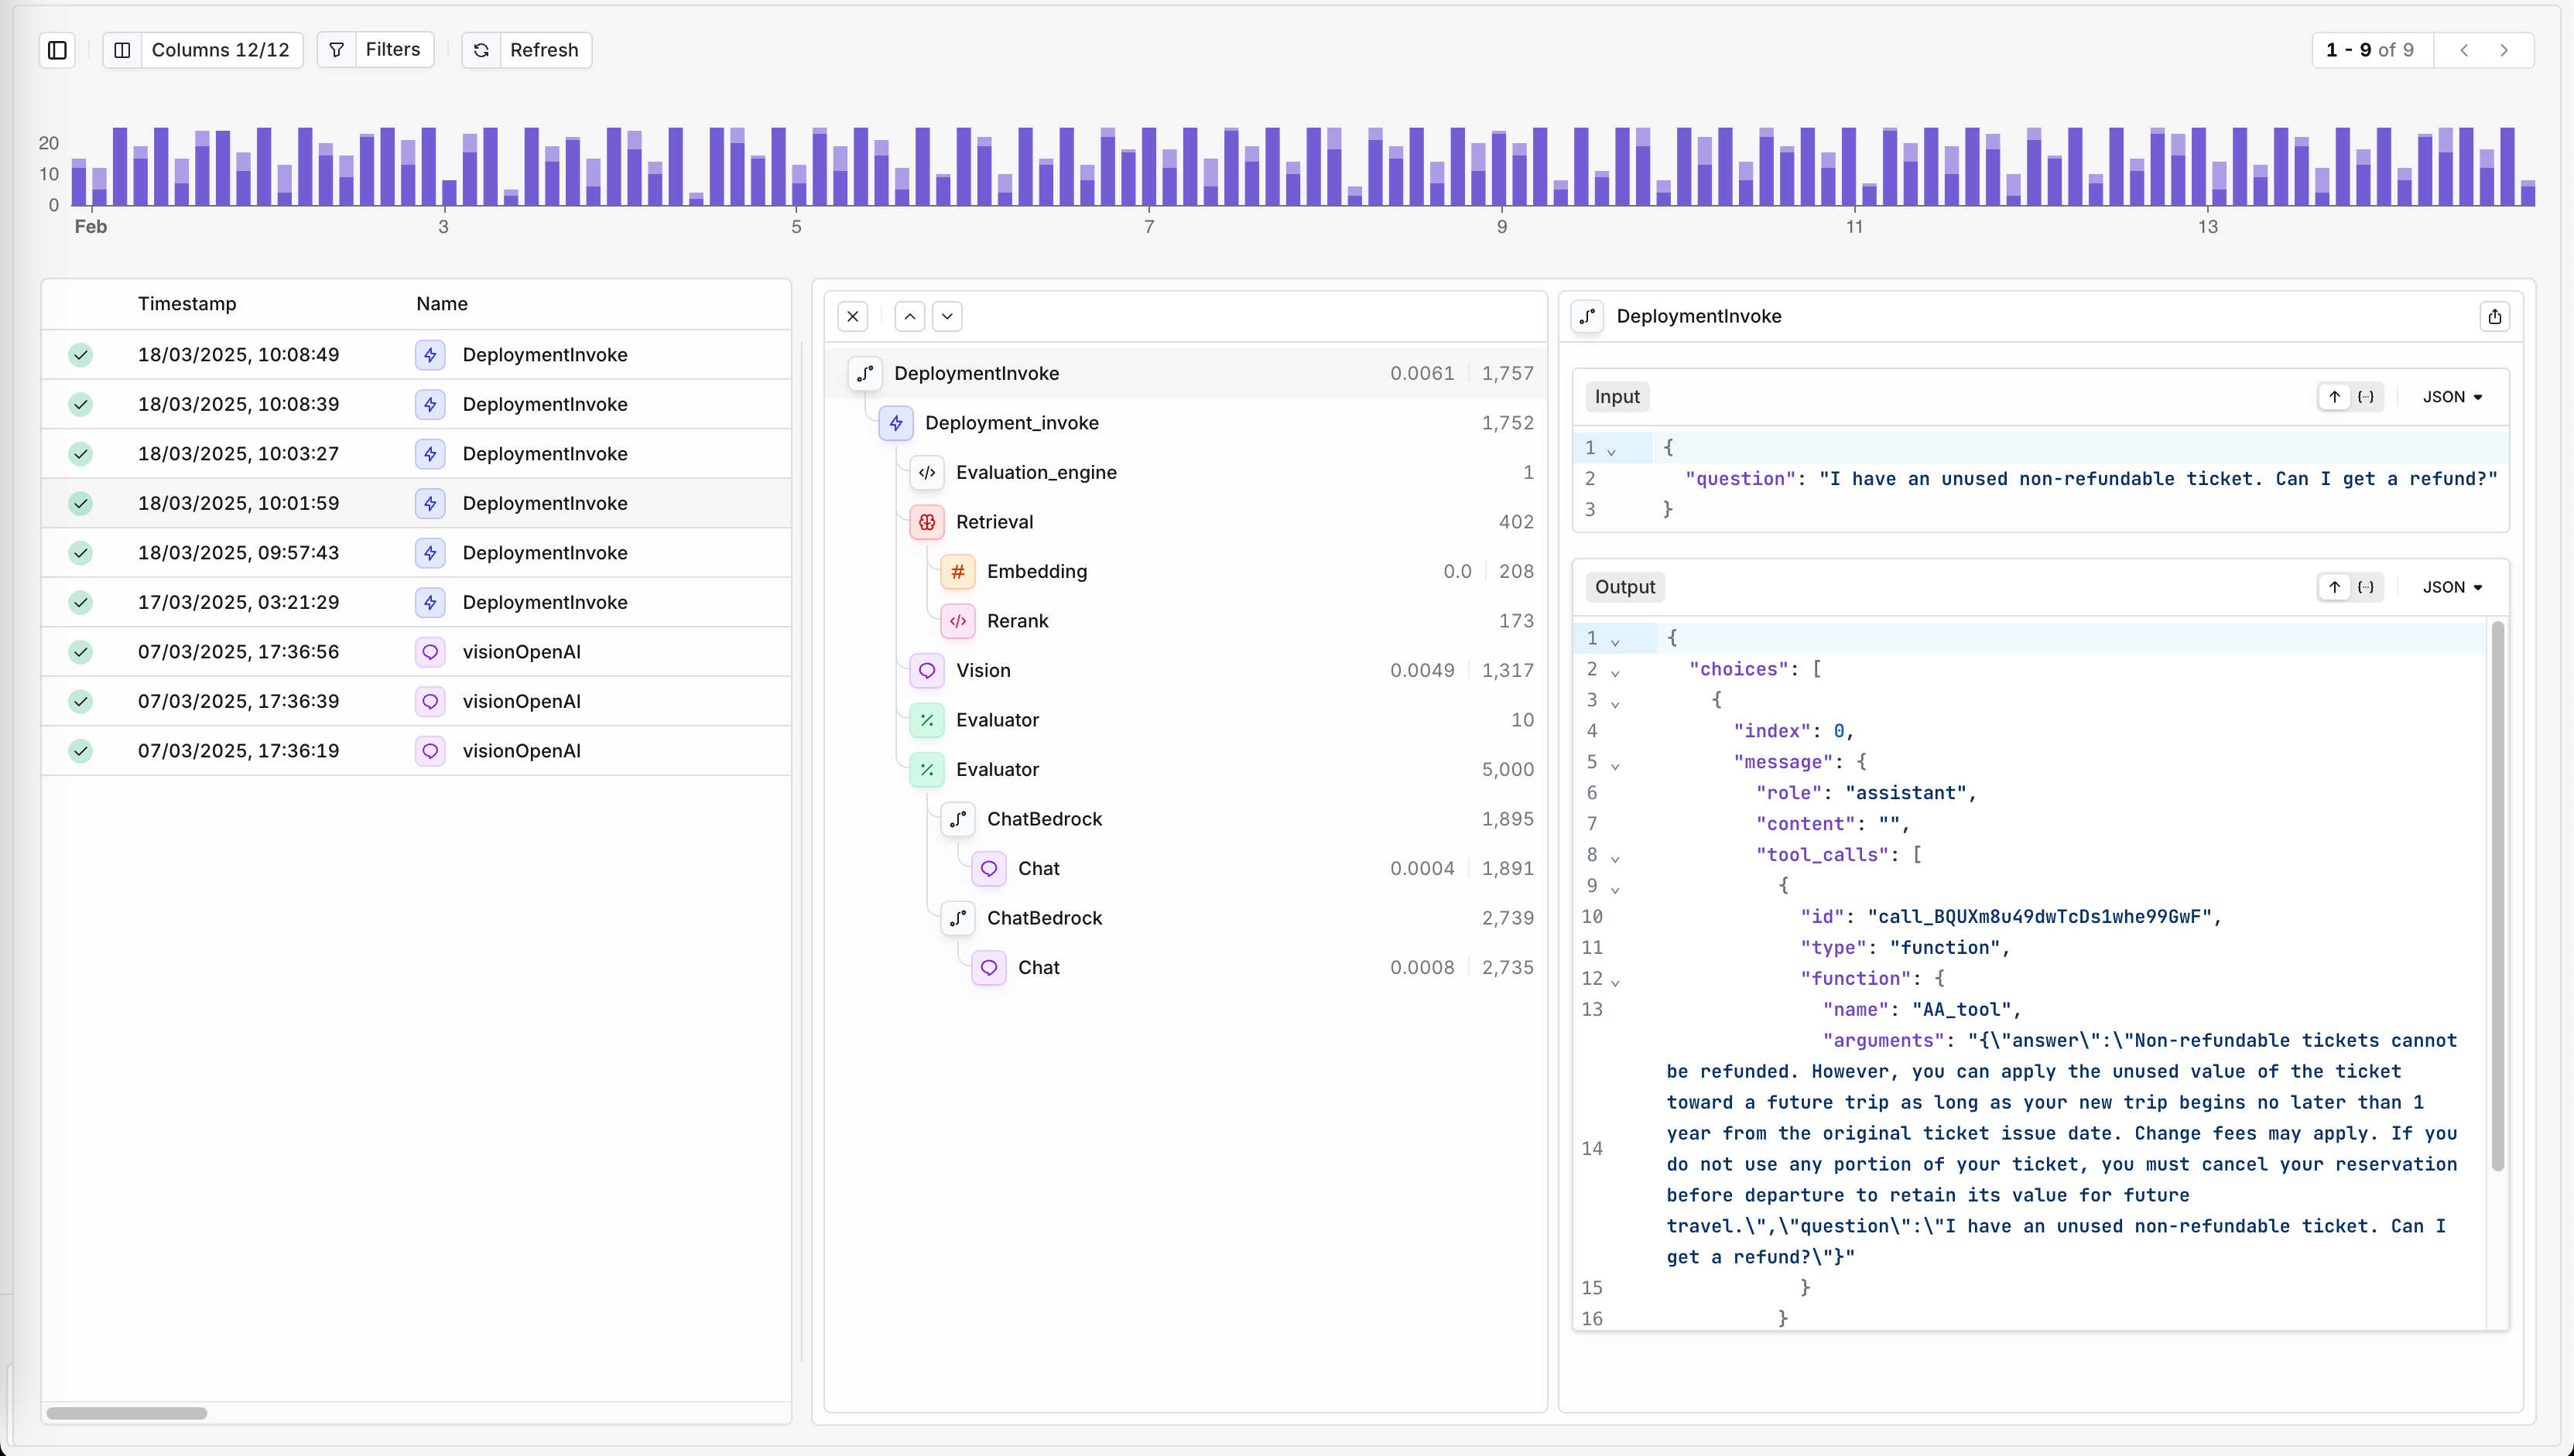
Each trace and event detail will hold usage and billing information.
Rate Limits
Our APIs are protected through Rate Limits on a per-account basis to ensure fair and efficient use of the API. This helps maintain optimal performance and prevent server overload, while also protecting against potential abuse and limiting costs effectively. When reaching rate limit, API calls are denied with a 429 Too Many Requests response.See Rate limits & quotas for how platform limits, budget limits, and provider limits interact.
To learn more about the Orq.ai Pricing options or to upgrade your plan, see Our Pricing Page.