Orq MCP is live: Use natural language to interrogate traces, spot regressions, and experiment your way to optimal AI configurations. Available in Claude Desktop, Claude Code, Cursor, and more. Start now →
Explore step-by-step details of every LLM generation. Debug RAG pipelines, evaluators, guardrails, and caching with full workflow visibility and cost tracking.
With Traces, dive into the workflow of each model generation and understand the inner workings of an LLM call on orq.ai.Traces correspond to events within the generations. Events within a Deployment can be various:
Traces are automatically generated when using Orq.ai Deployments. Create custom traces for application code using framework instrumentation or the Orq.ai SDK.
Each trace can be inspected in three views to suit different debugging and analysis needs.
Trace
Thread
Timeline
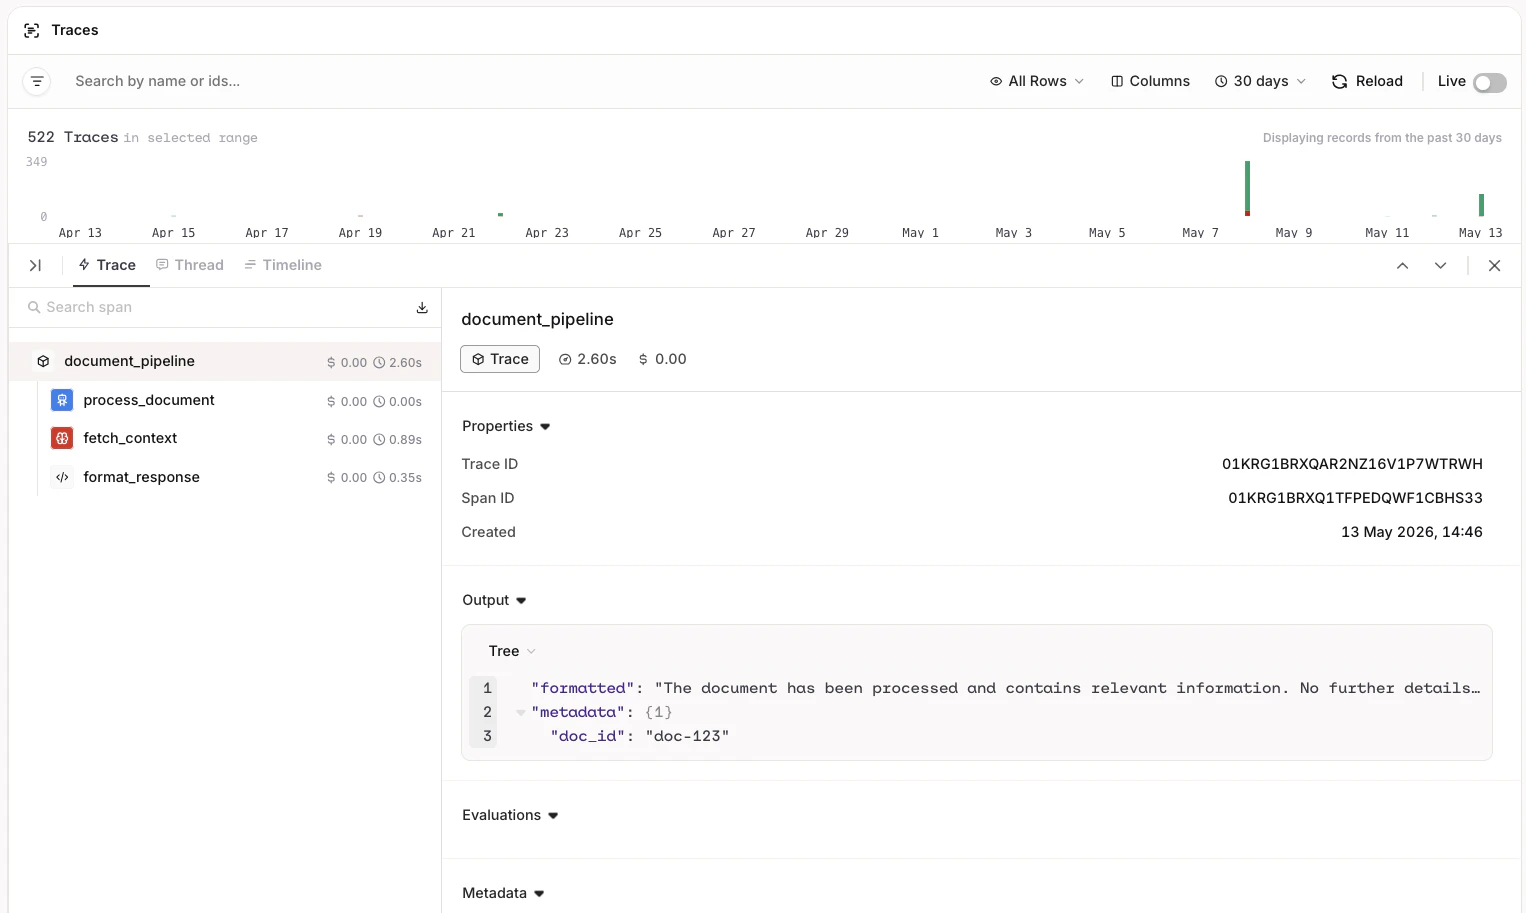
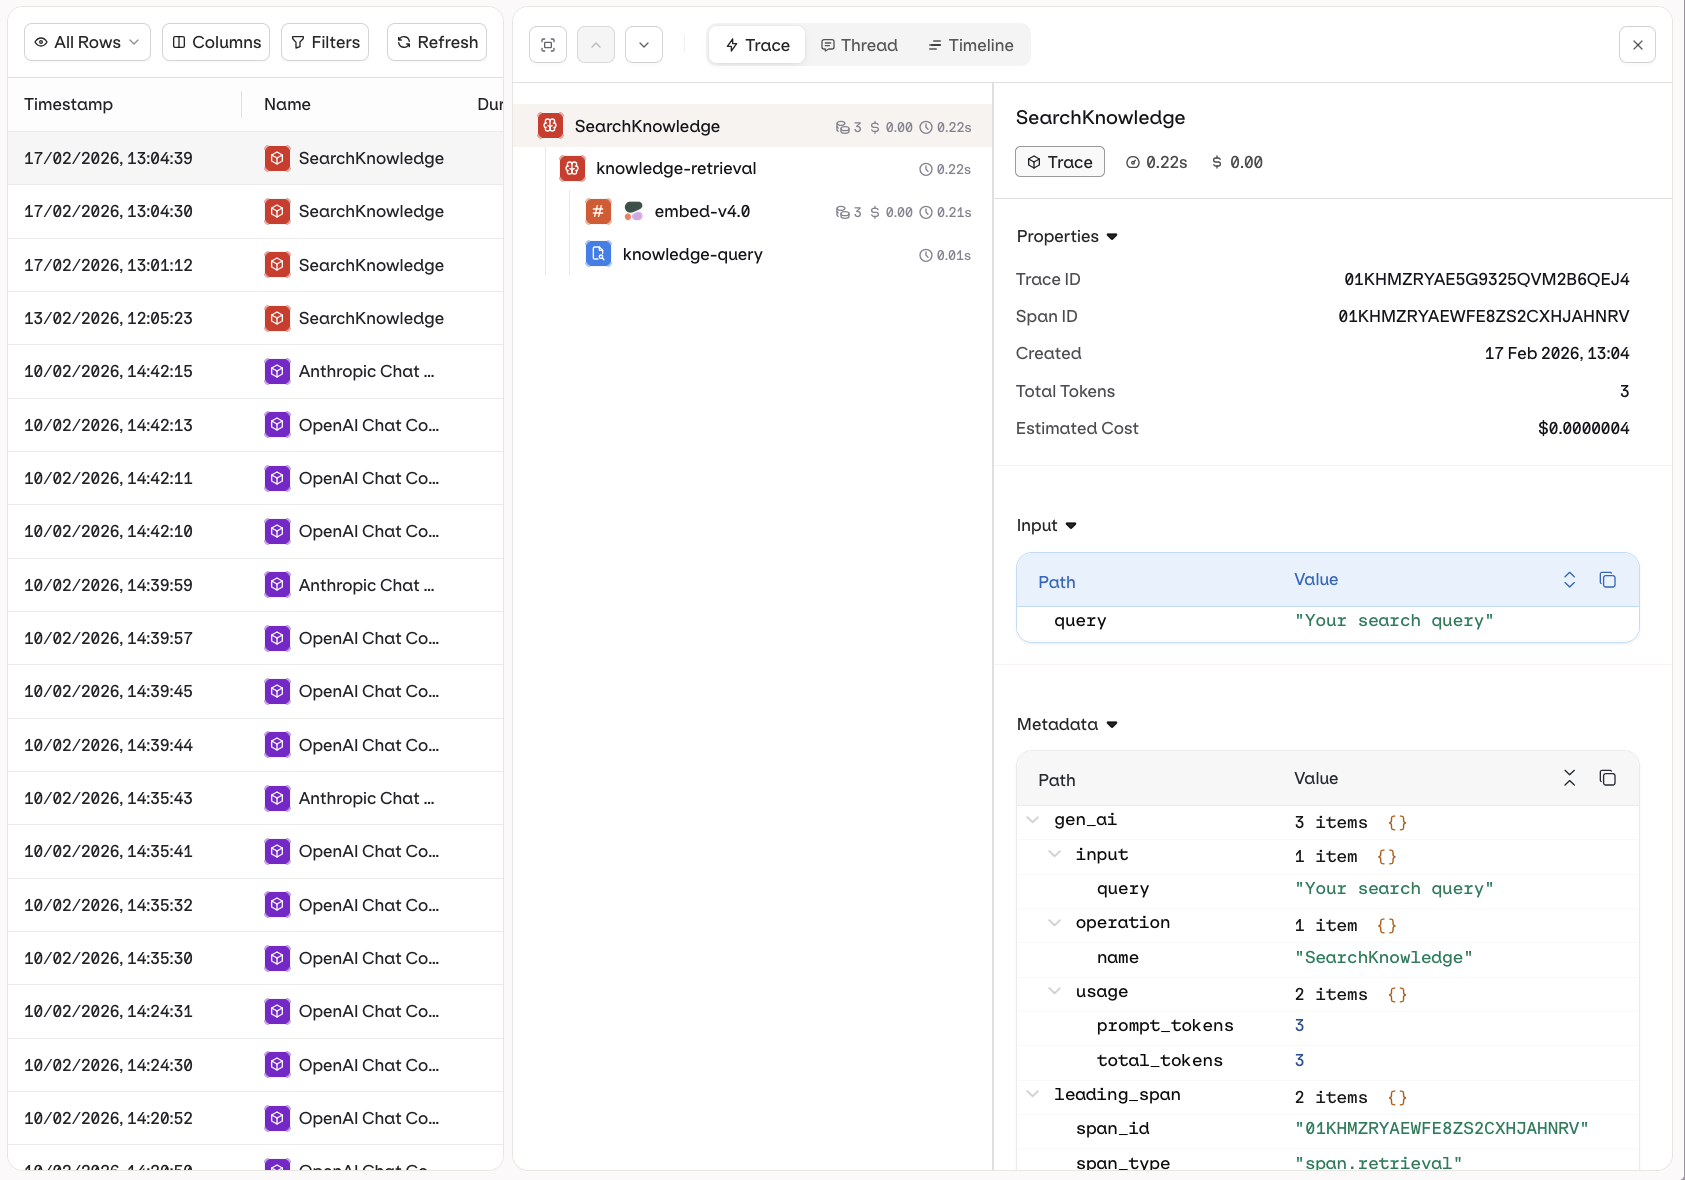
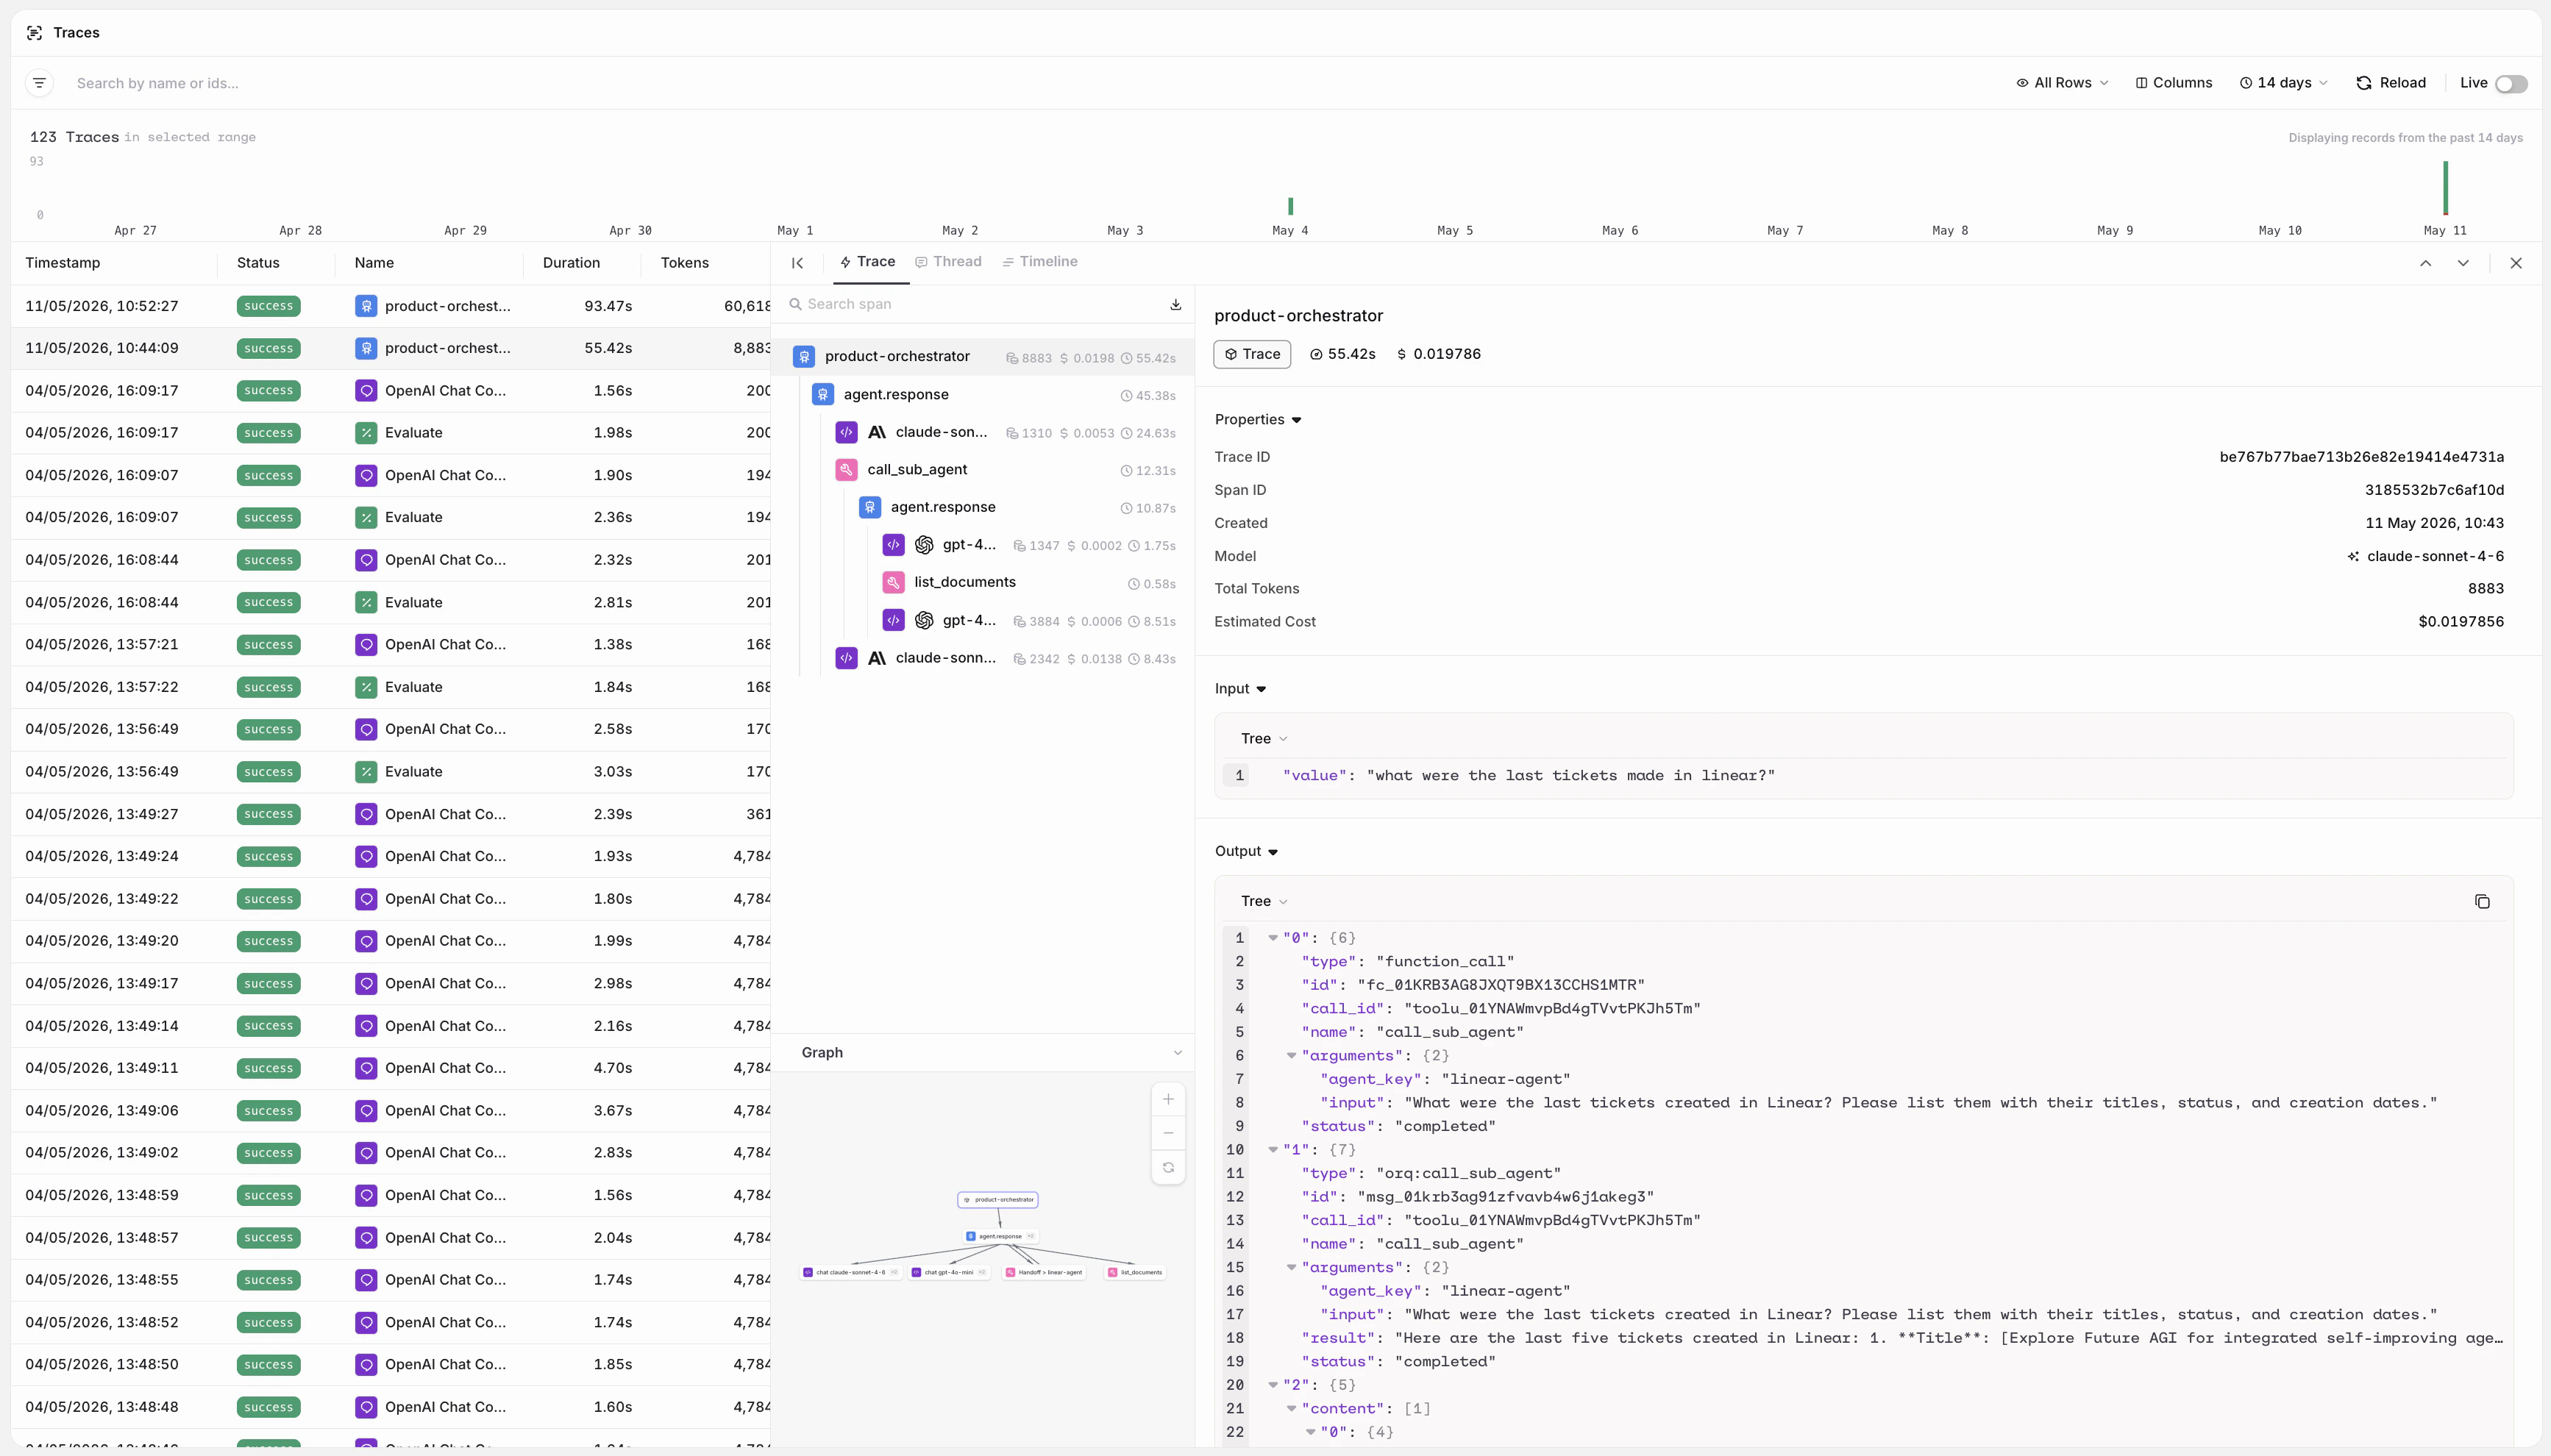
The Trace view shows the full execution tree for a single run. Each step is displayed hierarchically, including LLM calls, tool invocations, knowledge retrievals, and memory interactions. Use this view to inspect inputs, outputs, token usage, and latency at every step.For multi-agent runs, the hierarchy renders as an agent graph: parent agents and their sub-agent calls are shown as a nested tree, making it easy to follow how work was delegated across agents and where time was spent.
Erroring Traces are shown with a icon.
Manually evaluate responses using Human Reviews directly on individual spans. Human Reviews defined in the project are available on all spans automatically. Learn more in Human Review.
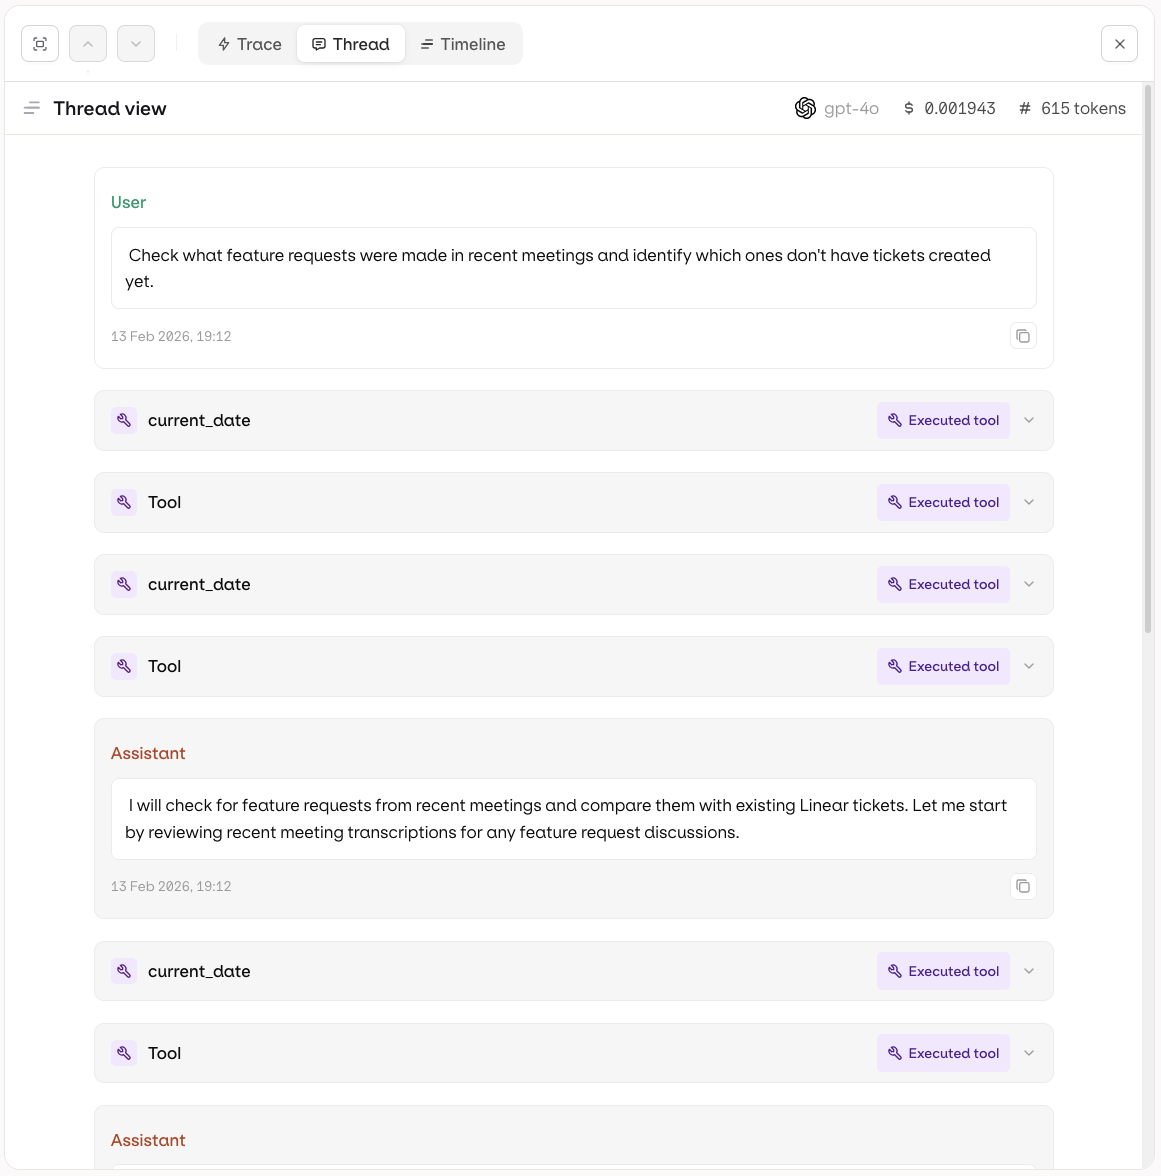
The Thread view presents the execution as a conversation thread, showing the sequence of messages exchanged between the user, the agent, and any tools. Use this view to follow the narrative flow of a task and understand how the agent reasoned through a problem.
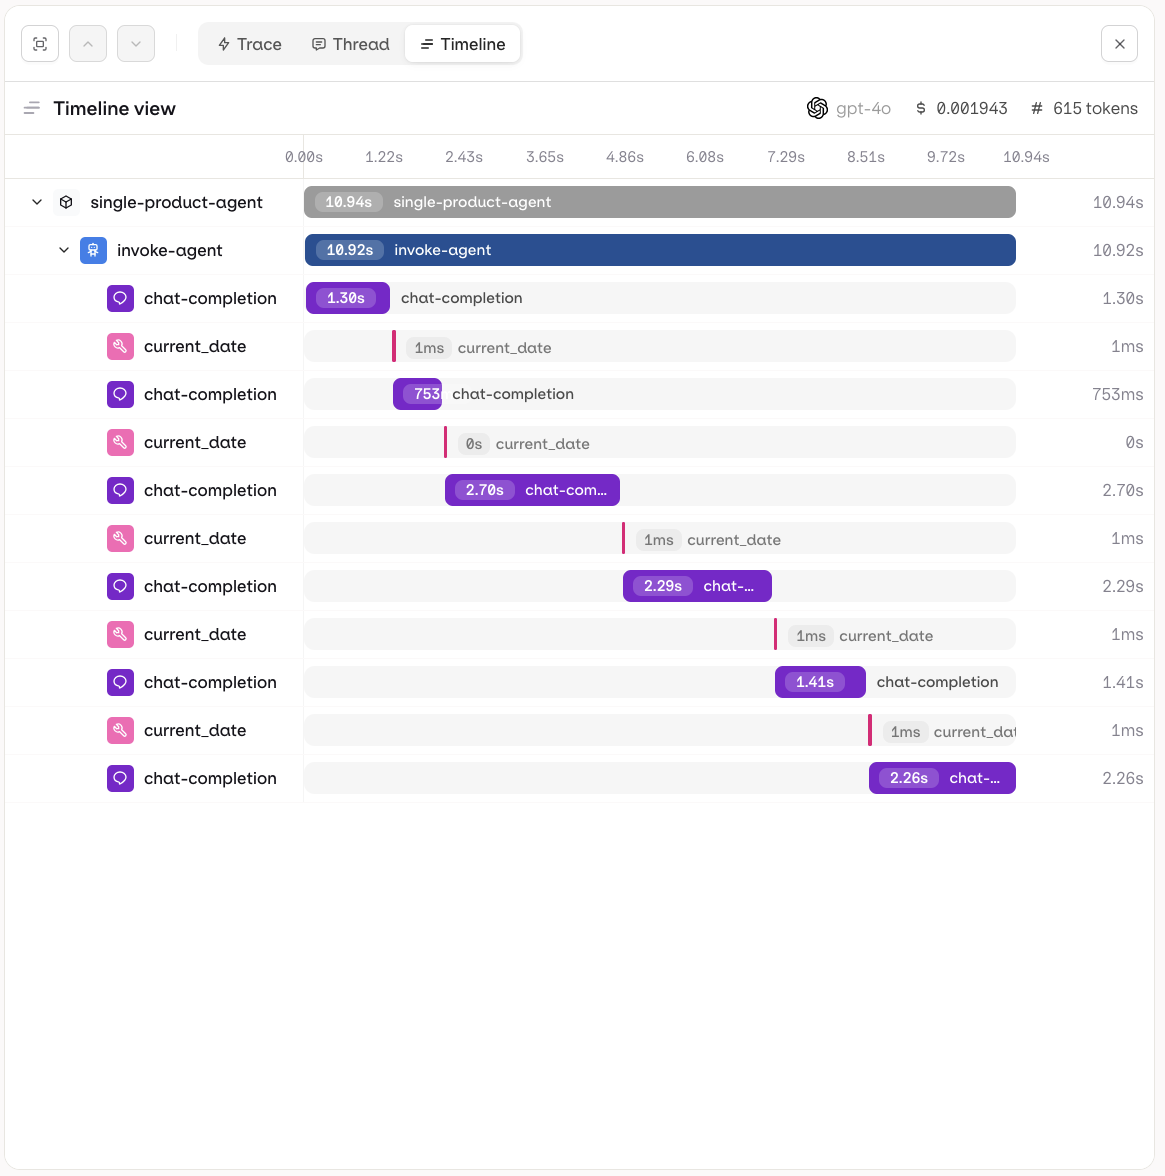
The Timeline view shows execution steps plotted against time, making it easy to identify bottlenecks, measure step durations, and understand which operations ran sequentially or in parallel.
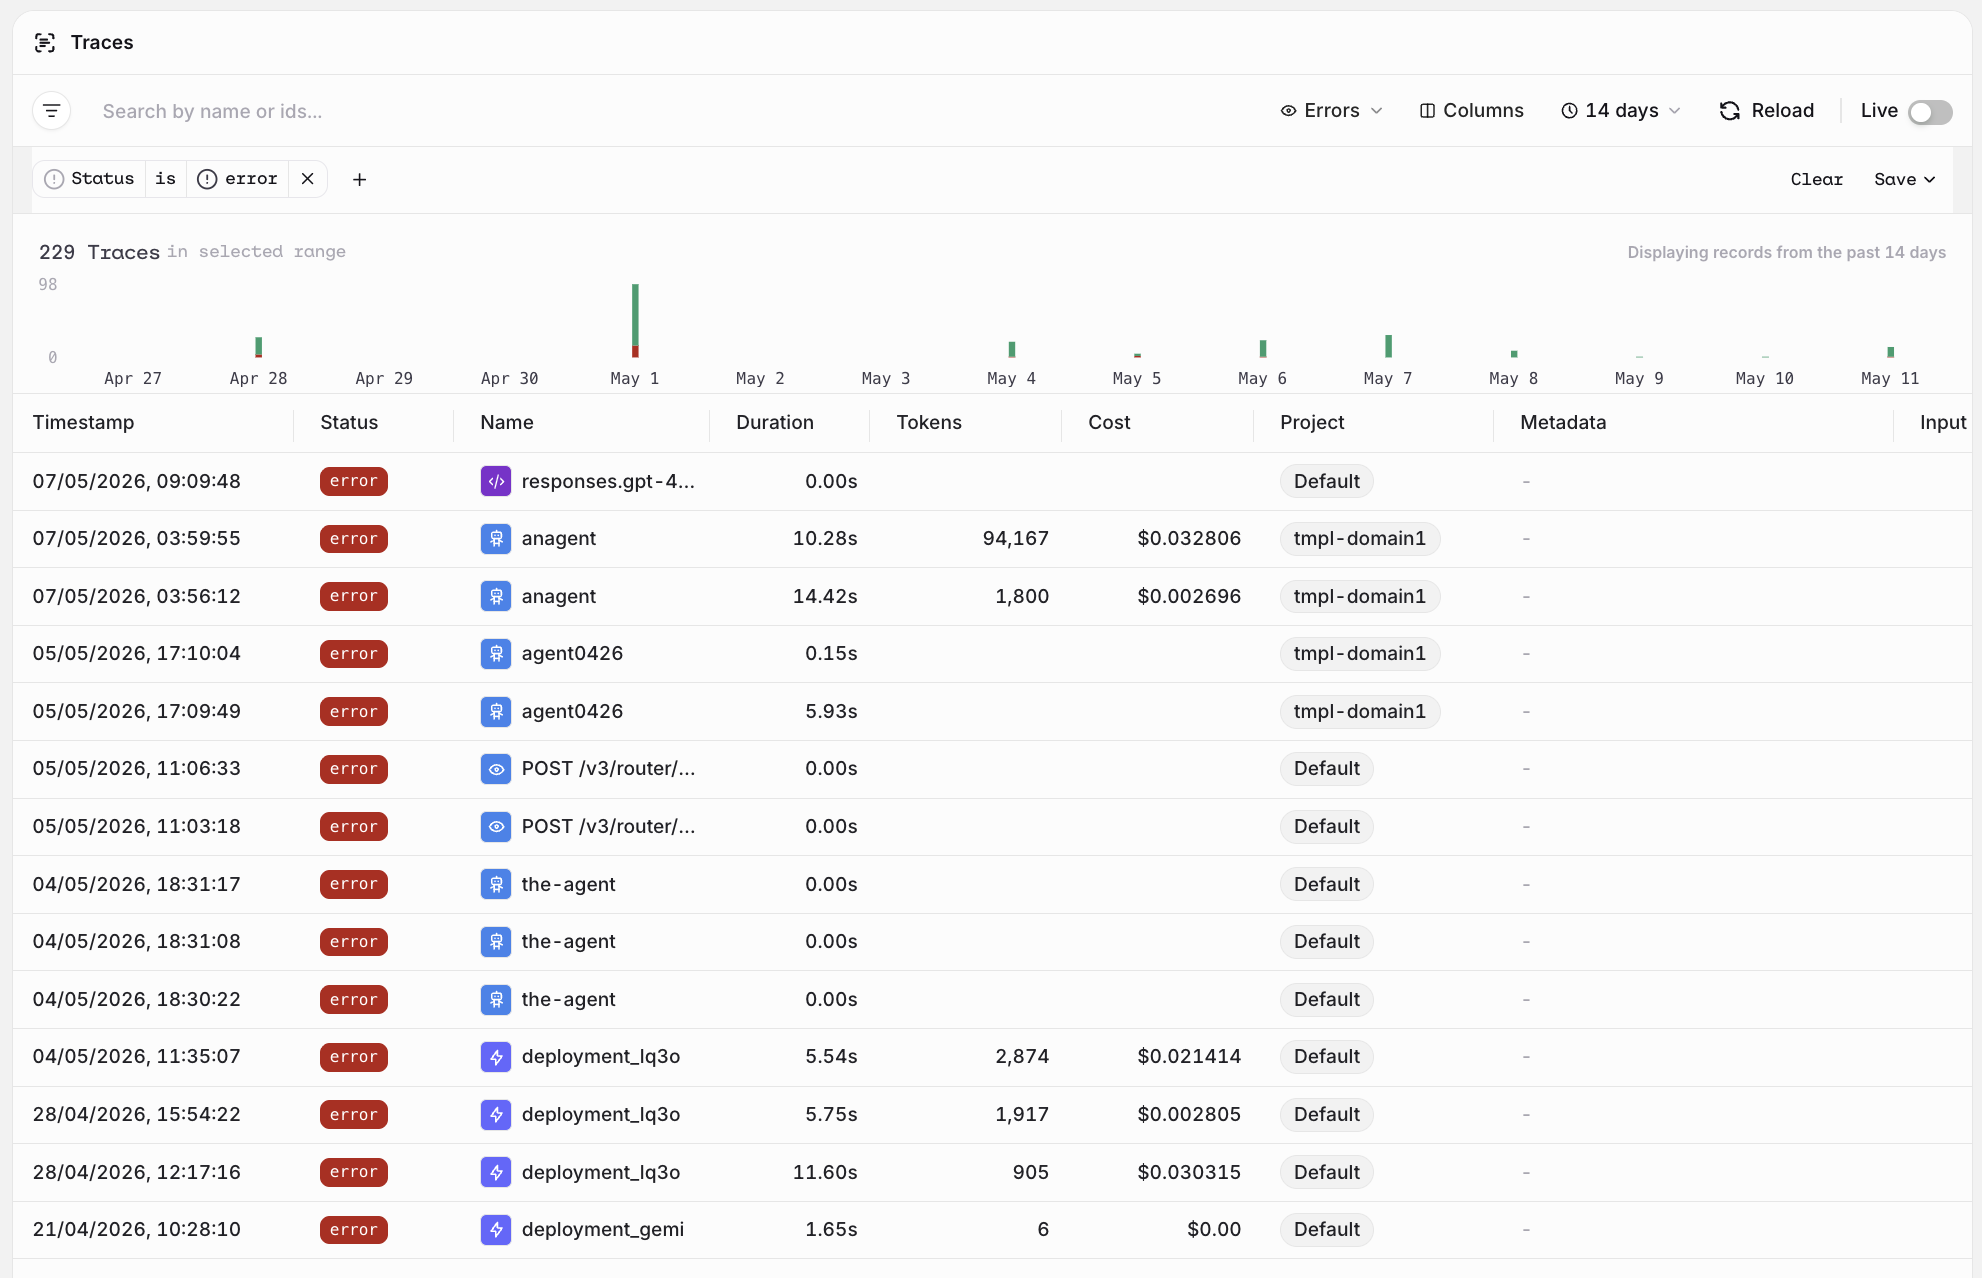
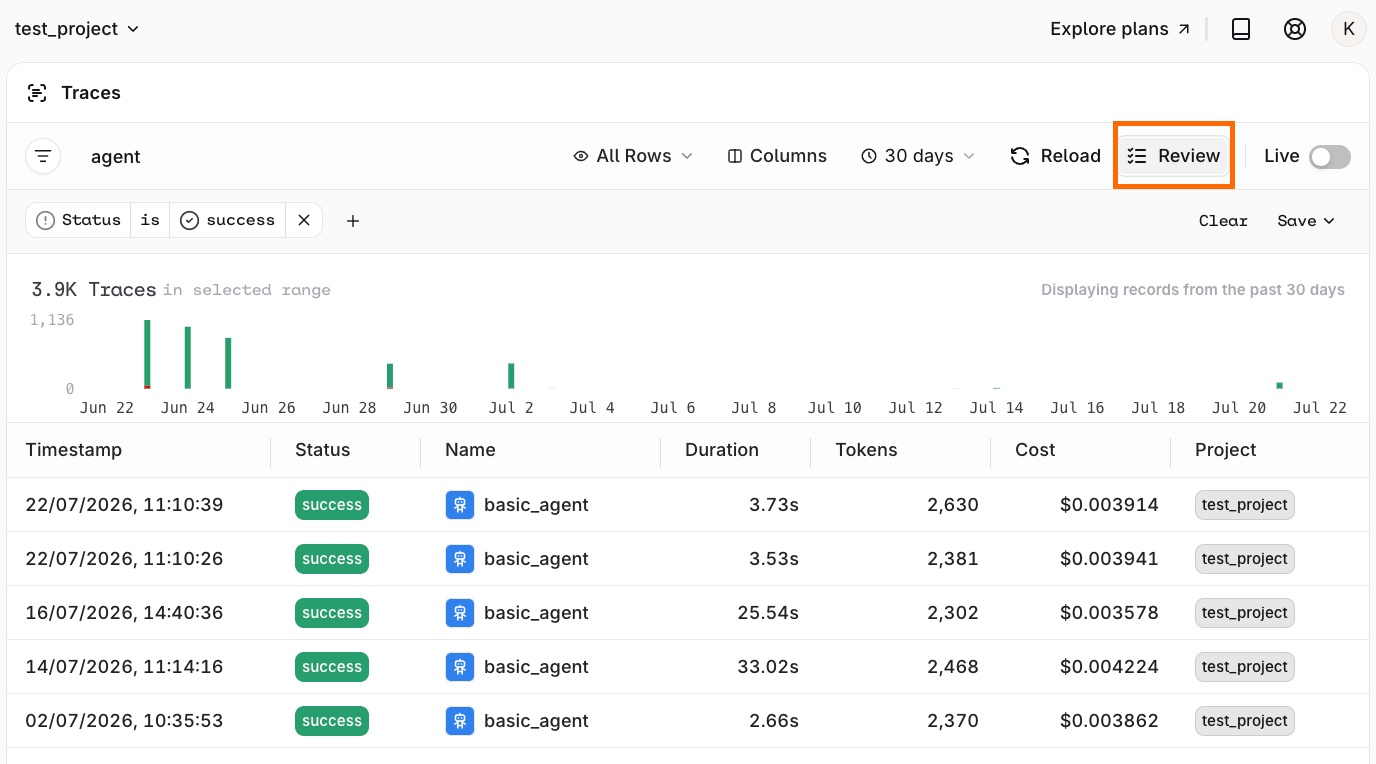
Traces that encountered an error are marked with a red error status badge in the list. Use the Status filter to scope the list to errors only and identify failing traces quickly.
Traces list filtered to error status.
The Status filter combines with any other filter, for example:
Filter by Status: error and an Identity to see all errors for a specific user.
Combine with Project or Metadata to narrow down failures to a particular environment or deployment.
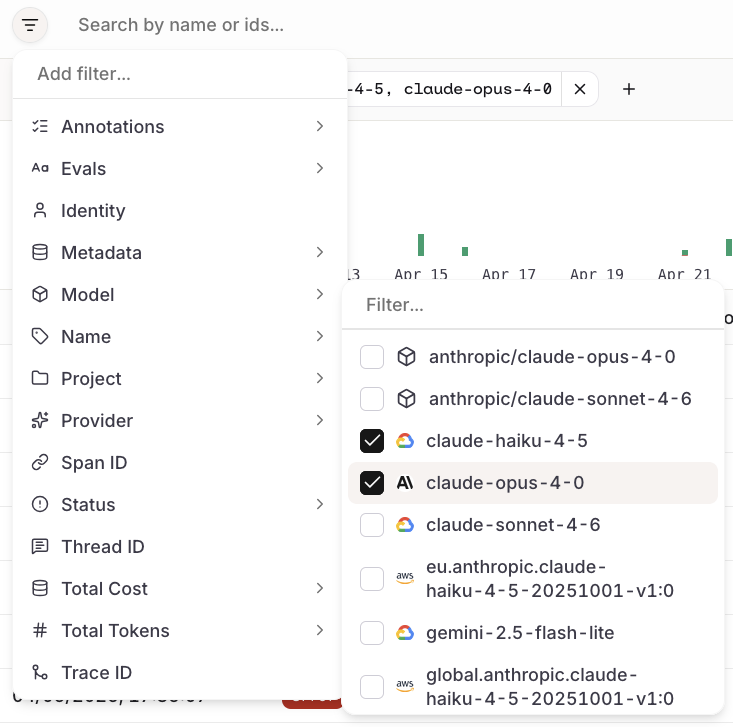
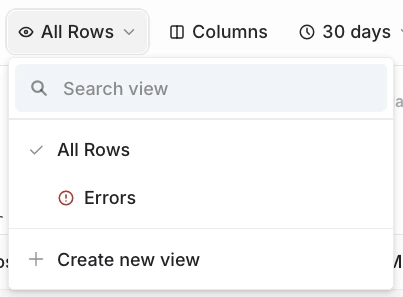
Click next to the search bar to open the filter menu. Select a category to expand a searchable list of values and check one or more to apply.
Trace filter categories.
When working with Agents, access traces directly from the Agent page with automatic filtering for that specific agent.
The following filter categories are available:
Filter
Description
Annotations
Filter by annotation labels applied to traces.
Evals
Filter by evaluator results attached to traces.
Identity
Filter by the identity that triggered the trace.
Messages
Filter by the number of iterations in the agent’s execution loop, not the number of user or assistant messages. A value of 1 means the model answered directly; each sequential tool round adds one. Parallel tool calls within a single round do not increase the count.
Metadata
Filter by metadata fields attached to traces.
Model
Filter by the model used in the trace.
Name
Filter by trace name.
Project
Filter by the project the trace belongs to.
Provider
Filter by the model provider.
Span ID
Filter by a specific span identifier.
Status
Filter by the status of the trace (e.g. error, success).
Thread ID
Filter by the thread the trace belongs to.
Total Cost
Filter by the total cost of the trace.
Total Tokens
Filter by the total token count of the trace.
Trace ID
Filter by a specific trace identifier.
The Messages count is calculated only for Agents running on Orq.ai. Traces imported from external frameworks have no value unless the instrumentation sends a numeric agent.iterations.count attribute.
Multiple filters can be combined. To remove a filter, click next to it in the filter bar.
Click Review in the toolbar to open the review screen and step through traces one by one. Applying one or more filters first narrows the review queue to matching traces; with no filter active, Review steps through the current list.
The review screen for Traces.
The screen follows the same three-panel layout as Annotation Queues:
Left: Inputs and Metrics for the selected span.
Center: Full trace conversation.
Right: Annotation controls for manual review. Select in the Annotations panel header to create a new annotation without leaving the screen.
Annotations applied here are written back to the span and are queryable via the Orq MCP.
Hover an Evaluator result to reveal a , and select it to open a popover with:
Value: the corrected result, matching the Evaluator’s own output type (a toggle for boolean Evaluators, a text or number field otherwise).
Explanation: an optional comment.
Select Correct to submit, or Update to replace an existing correction. The correction appears under the original result as Corrected to <value>, along with the explanation and the reviewer’s name.
Correcting an Evaluator result in the Traces review screen.
Corrections are written back to the Trace like any other annotation. This gives a basis to compare an Evaluator’s own results against reviewer corrections over time, using that signal (for example through the Orq MCP) to see where an Evaluator’s configuration may need adjustment.
This corrects the Evaluator’s result, not the AI response text. For rewriting the response itself, use the Logs Add a Text Correction flow.