Why this exists
As AI adoption scales, agents end up scattered across teams, repositories, and frameworks. Different departments build on different tools. Nobody has one place to see what’s running, what it costs, or whether it’s approved. The Agent Control Tower solves this. It’s a single source of truth for your entire AI landscape, whether agents were built on Orq, OpenAI, Vercel, LangGraph, or any other framework. One dashboard instead of five systems.The Live Monitoring Overview
Your executive dashboard. Six metric cards give you an instant health check. View the full Control Tower Overview for real-time monitoring.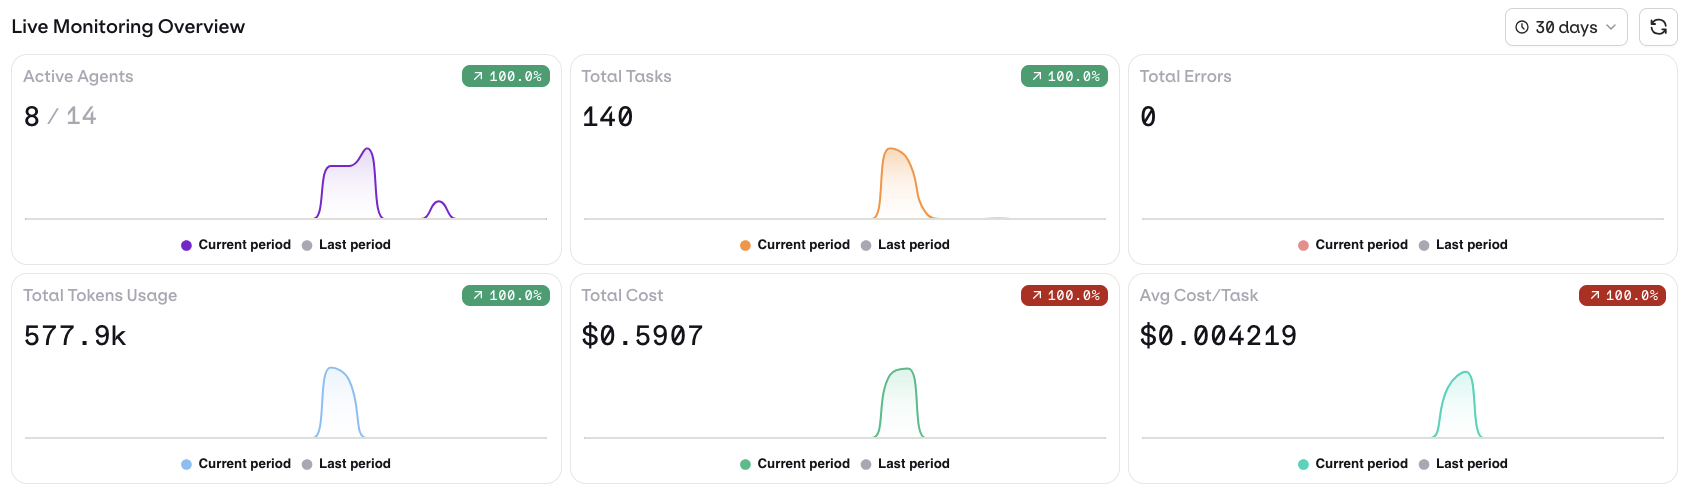
| Metric | What it tells you |
|---|---|
| Active Agents | How many agents are running vs. registered. Low ratio = adoption or retirement questions. |
| Total Tasks | Tasks processed in the selected period. Your throughput indicator. |
| Total Errors | Errors across all agents. Rising errors + flat tasks = something is degrading. |
| Total Tokens Usage | Raw token volume. Drives cost and shows overall compute load. |
| Total Cost | What your AI operations cost. The number your CFO will ask about. |
| Avg Cost/Task | Cost per task. Helps spot efficiency differences between agents. |
Agents Performance table
Below the metrics, every agent in your organization is listed with its name, environment tags, department, cost, invocations, and errors. This is your inventory: one place to answer “what agents do we have and what are they doing?”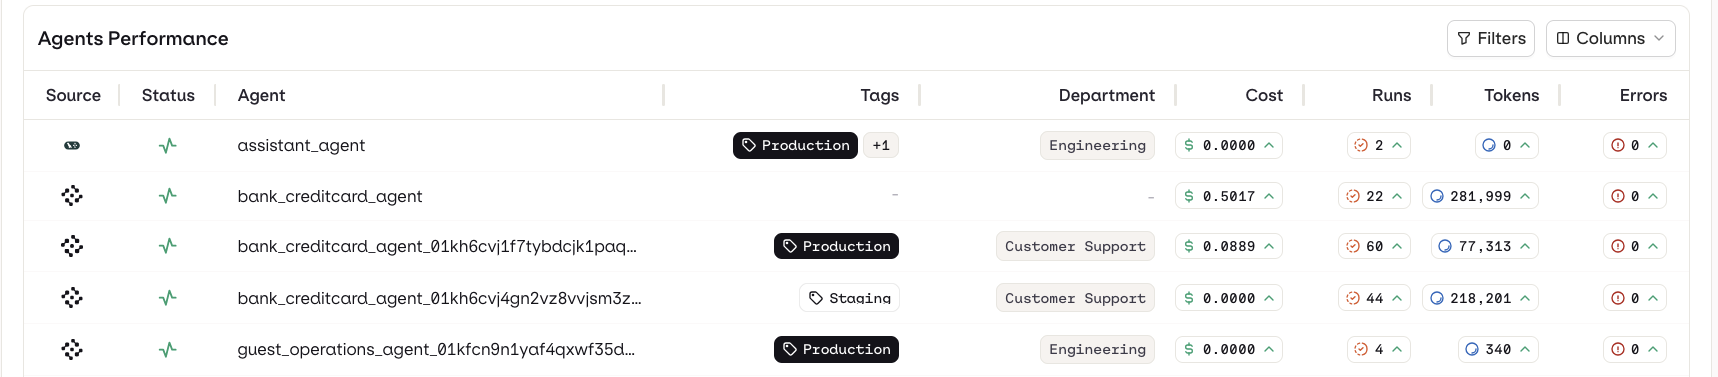
The Assets view
Drill deeper across four tabs: Agents, Tools, Deployments, and Models. See the Assets documentation for detailed information.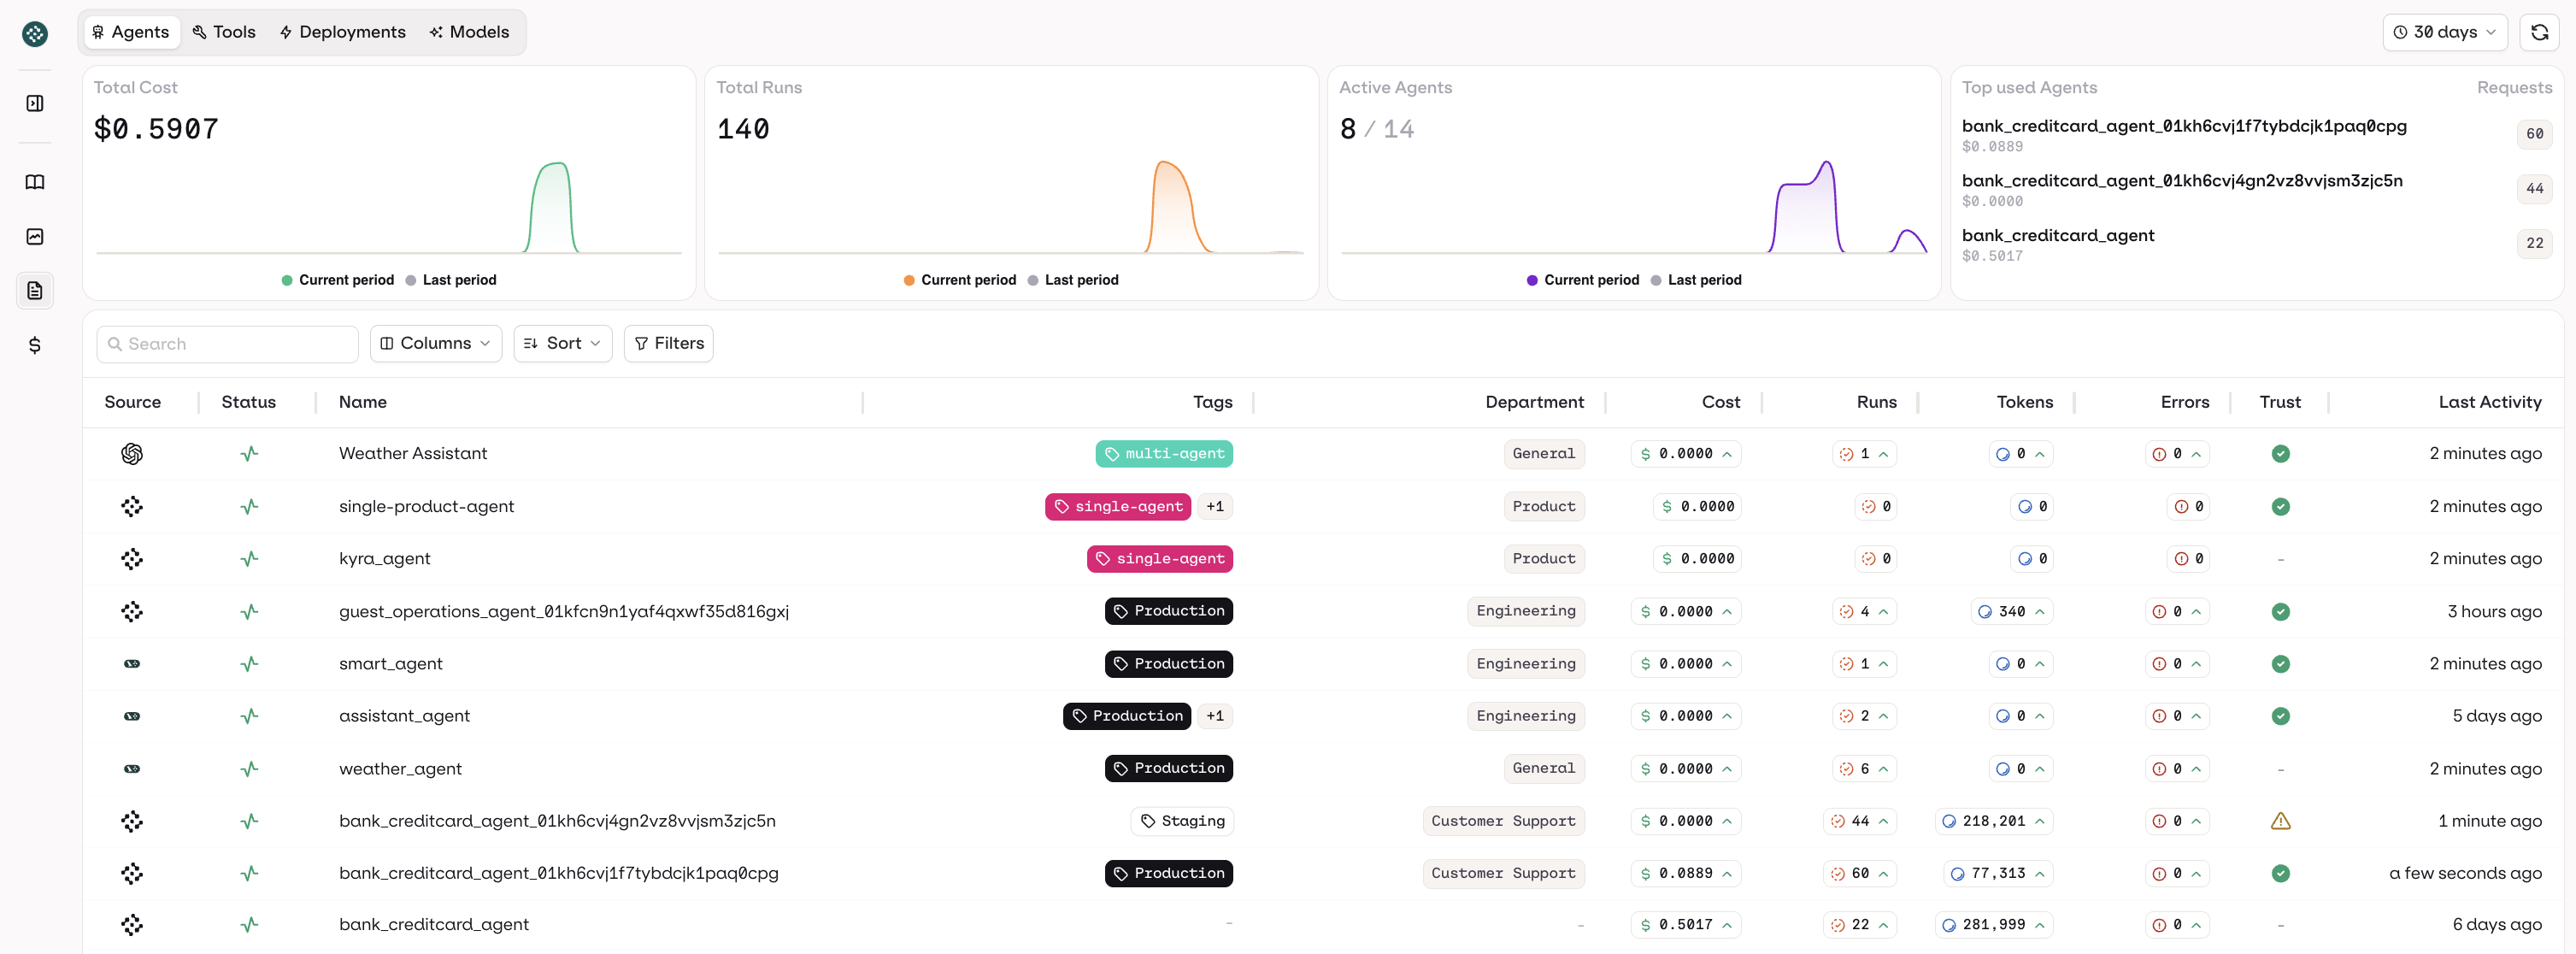
Key concepts
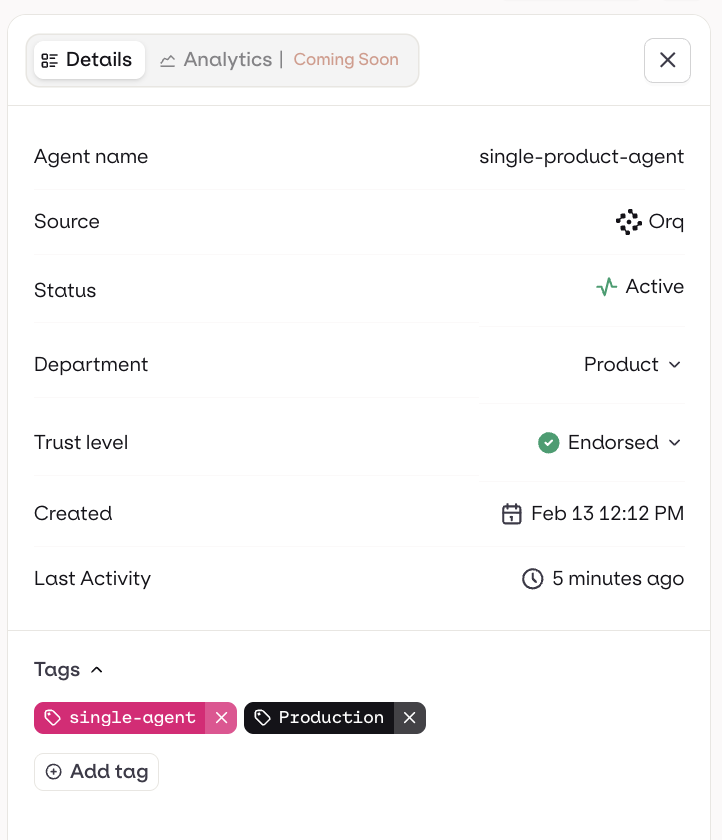
Endorsement A green “Production” badge means a human has signed off on that agent. Think of it as a quality gate. No badge? It may be experimental or unreviewed. Your question should always be: which production agents are endorsed, and which are running without sign-off?
Your weekly checklist
Five things to check that keep you informed and ahead of problems.| Check | What to look for |
|---|---|
| Cost trend | Is the Total Cost period-over-period comparison stable? Sudden spikes mean something changed: new agent, looping behavior, or model upgrade. Sort Assets by cost to find the source. |
| Error rate | Total Errors relative to Total Tasks. If the ratio climbs, drill into the Performance table to find which agent is failing and take it to engineering with a specific ask. |
| Active agents | Compare active vs. registered. Unrecognized active agents = governance gap. Expected agents that are idle = adoption or reliability issue. |
| Endorsement coverage | Scan the Performance table for production agents without endorsement. Every production agent should be signed off. |
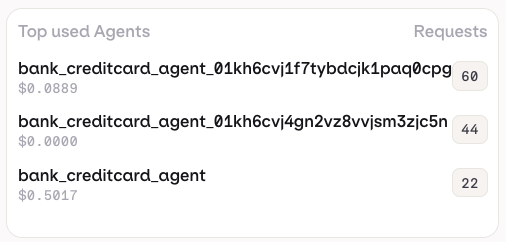
| Top consumers | Check the Top Used Agents widget. The top agents drive most of your cost and volume. Make sure you know what they do, who owns them, and whether usage is expected. |