

Create
Set up a Deployment with a key, model, and system prompt in AI Studio or via MCP.
Configure
Set the model, fallbacks, variables, knowledge base, tools, caching, and guardrails per Variant.
Routing
Route traffic across Variants by environment, context attributes, or percentage split.
Versioning
Deploy and roll back configurations without a code release.
Invoke
Call a Deployment via API or SDK and pass identity, usage tracking, and extra parameters.
Analytics
Monitor requests, filter logs by Variant, and inspect full request details.
Create a Deployment
 AI Studio
 MCP
MCP
Open the AI Studio
Choose a Project and folder, then select the button.
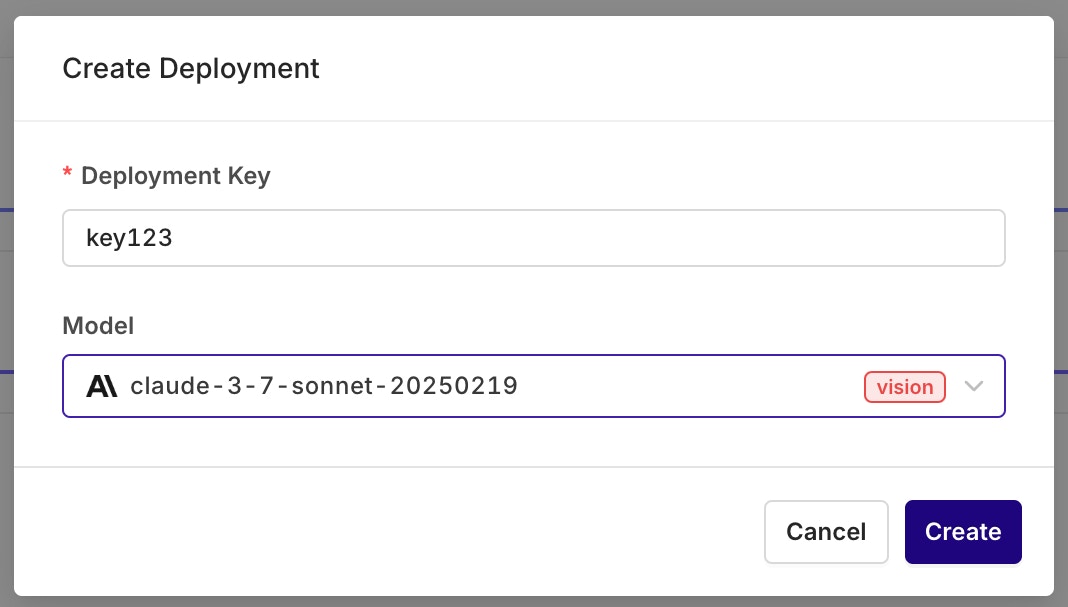
Configure a Variant
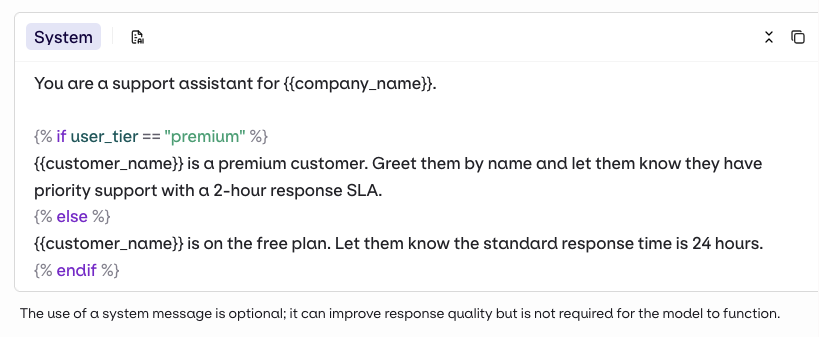
Variants are different prompt and model configurations available behind one Deployment. A Deployment can hold any number of Variants. On creation, the Variant screen opens for model and prompt setup.A Variant Prompt is similar to any other prompt. To learn how to configure a Prompt, see Creating a Prompt.
Primary Model, Retries, and Fallback
- AI Studio
The Primary Model panel defines the first model queried through this Variant.RetriesIn case of failure, configure how many times a query is retried with this model.Error handling flow: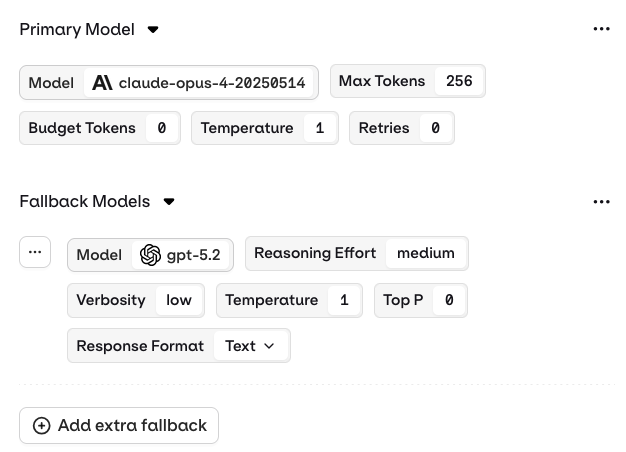
Retries are only triggered when a retry count greater than 0 is configured in the Variant settings.When retries are enabled, Orq.ai automatically retries the model provider API call if it returns one of the following HTTP status codes:
- 429 Rate Limit Exceeded
- 500 Internal Server Error
- 501 Not Implemented
- 502 Bad Gateway
- 503 Service Unavailable
- If an error code above is returned and retries are configured (retry count > 0), Orq.ai retries the Primary Model.
- If all retry attempts fail (or no retries are configured) AND a Fallback Model is configured, Orq.ai routes to the Fallback Model.
- If the Fallback Model also fails, the error is returned to the calling application.
See how fallbacks and retries work together in a production system. Read our cookbook Customer Support Chat.
- Success on first try: Response returned immediately.
- Retry scenario: Response may be delayed by up to
base_latency × (retry_count + 1)to account for the initial attempt plus all configured retries. - Fallback invoked: Additional latency as the Fallback Model processes the request.
- All retries and fallback failed: Error returned to the calling application.
Structured Outputs
- AI Studio
Configure structured outputs to ensure consistent and reliable responses from a Deployment. Structured outputs specify the exact format the model should follow when generating a response.Two modes are available: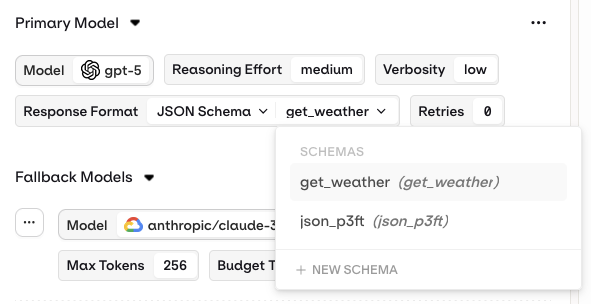
- JSON Mode: the model automatically returns a valid JSON object for every generation.
- JSON Schema: define a schema that explicitly describes the fields, types, and structure of the model output.
Variables and Prompt Templating
- AI Studio
- API & SDK
Reference dynamic values in the prompt using double braces: Orq.ai supports three template engines. Select the Template Engine from the Variant Settings panel: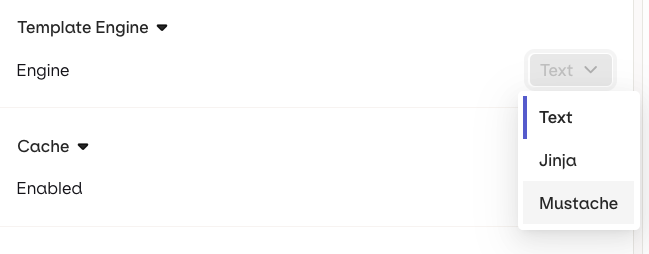
{{variable_name}}. Pass a key-value map to the inputs field when invoking and Orq.ai substitutes each variable before sending the prompt to the model.- Text (default): variables use
{{double_braces}}syntax. - Jinja: full templating with conditionals, loops, filters, and more.
- Mustache: logic-less templating with sections.

For a complete reference of all template features including filters, macros, nested objects, and more, see Prompt Templating.
To prevent sensitive input values from appearing in traces and logs, see Security and Privacy.
Knowledge Base
- AI Studio
- API & SDK
Ground a Deployment’s responses in domain-specific knowledge by adding a Knowledge Base.Open the deployment configuration, go to Knowledge Bases, then select Knowledge Base.Configuration options (via the 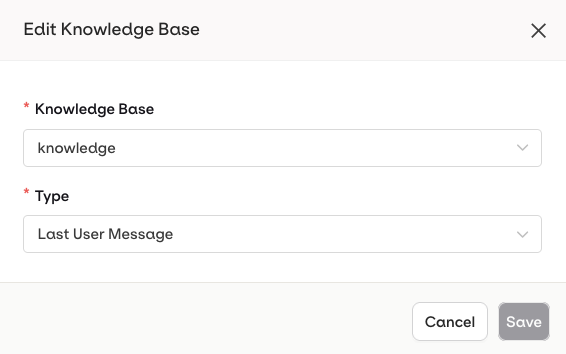
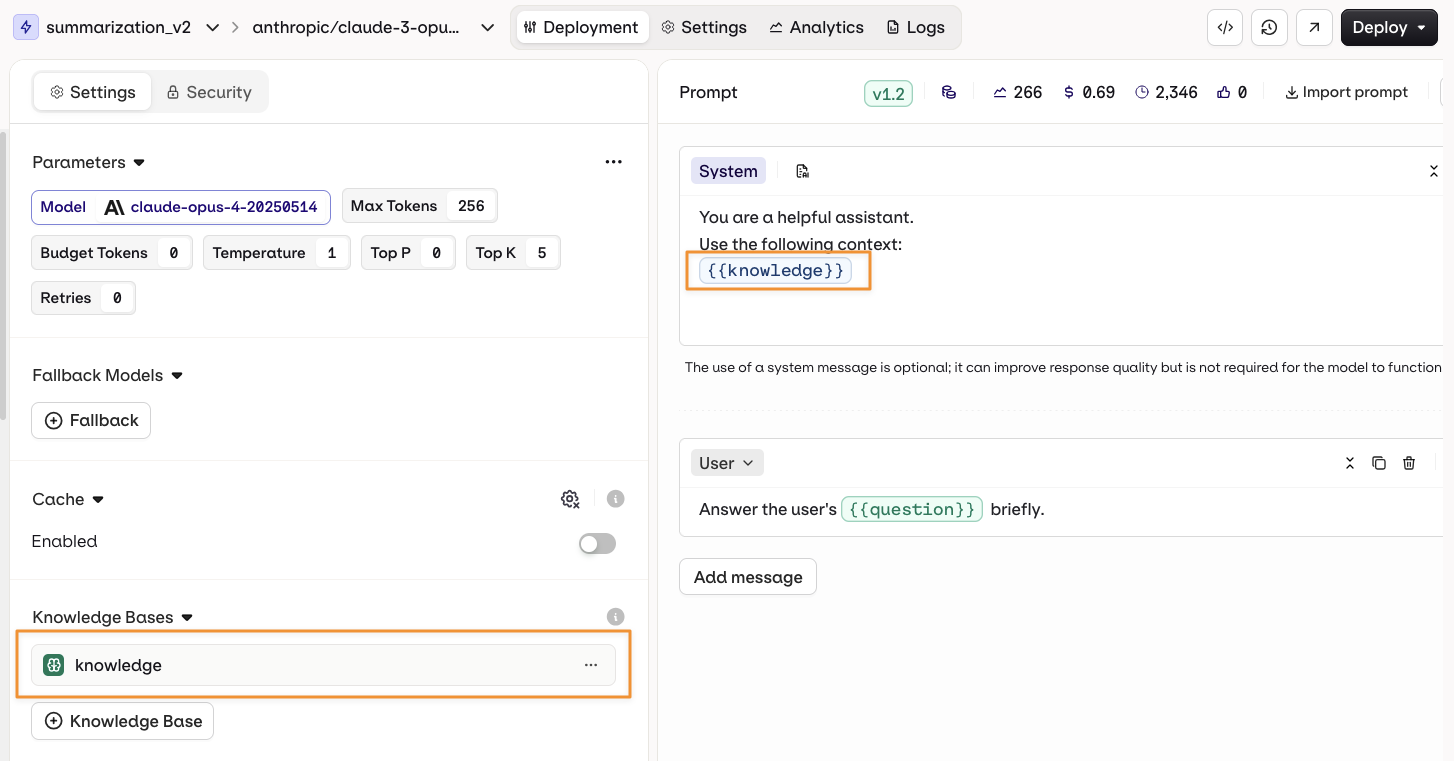
Knowledge Bases enable RAG (Retrieval-Augmented Generation), allowing the model to retrieve and use relevant information from documentation or data sources to provide more accurate and contextual responses.
... menu on an attached Knowledge Base):- Last User Message: the user’s latest message is automatically used as a query to retrieve relevant chunks.
- Query: a predefined query is used to retrieve chunks. Use Input Variables like
{{query}}to make it dynamic at runtime.
To learn more about creating and configuring Knowledge Bases, see Knowledge Bases.
{{knowledge_base_key}} syntax, where knowledge_base_key is the identifier of the Knowledge Base. If the Knowledge Base is not explicitly referenced in the prompt, retrieved chunks are automatically appended to the end of the system message.See knowledge base retrieval used end-to-end in a working deployment. Read our cookbook Multilingual FAQ Bot.
Tools
- AI Studio
Tools can only be added and configured at the deployment level. Only Function tools are supported in Deployments, enabling the model to call external functions during execution.To add a Function tool, open the Tools tab in the deployment configuration and click Tool: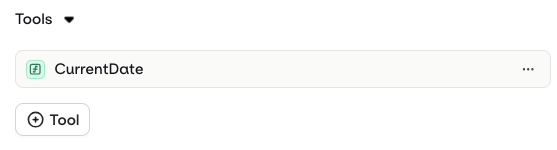
- Create a new Tool: define a custom function directly within the deployment.
- Import an existing Tool: select a previously created Function tool from the resource library.
To learn more about creating Function tools, see Creating Tools.
Cache
- AI Studio
Variant generation can be cached to reduce processing time and cost. When an input is received that matches a cached entry within the Variant, the stored response is returned directly without triggering a new generation.To enable caching, open the Variant Settings tab and select Enabled in the Caching section. The cache can be manually invalidated at any time by clicking the configuration icon.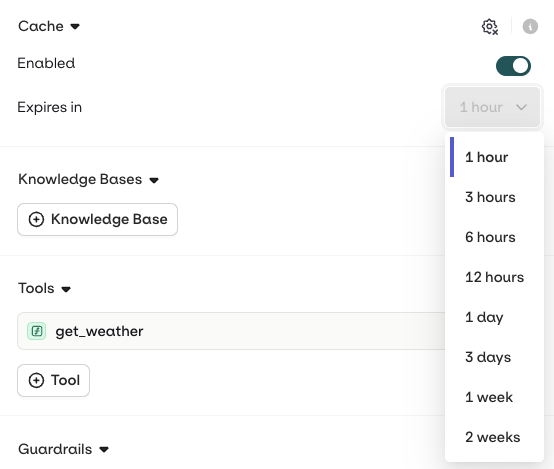
The cache only works when there is an exact match. Image models are not supported.
Evaluators and Guardrails
- AI Studio
Evaluators and Guardrails are configured as separate sections in the variant settings. Both operate on the generation pipeline but with different behaviours.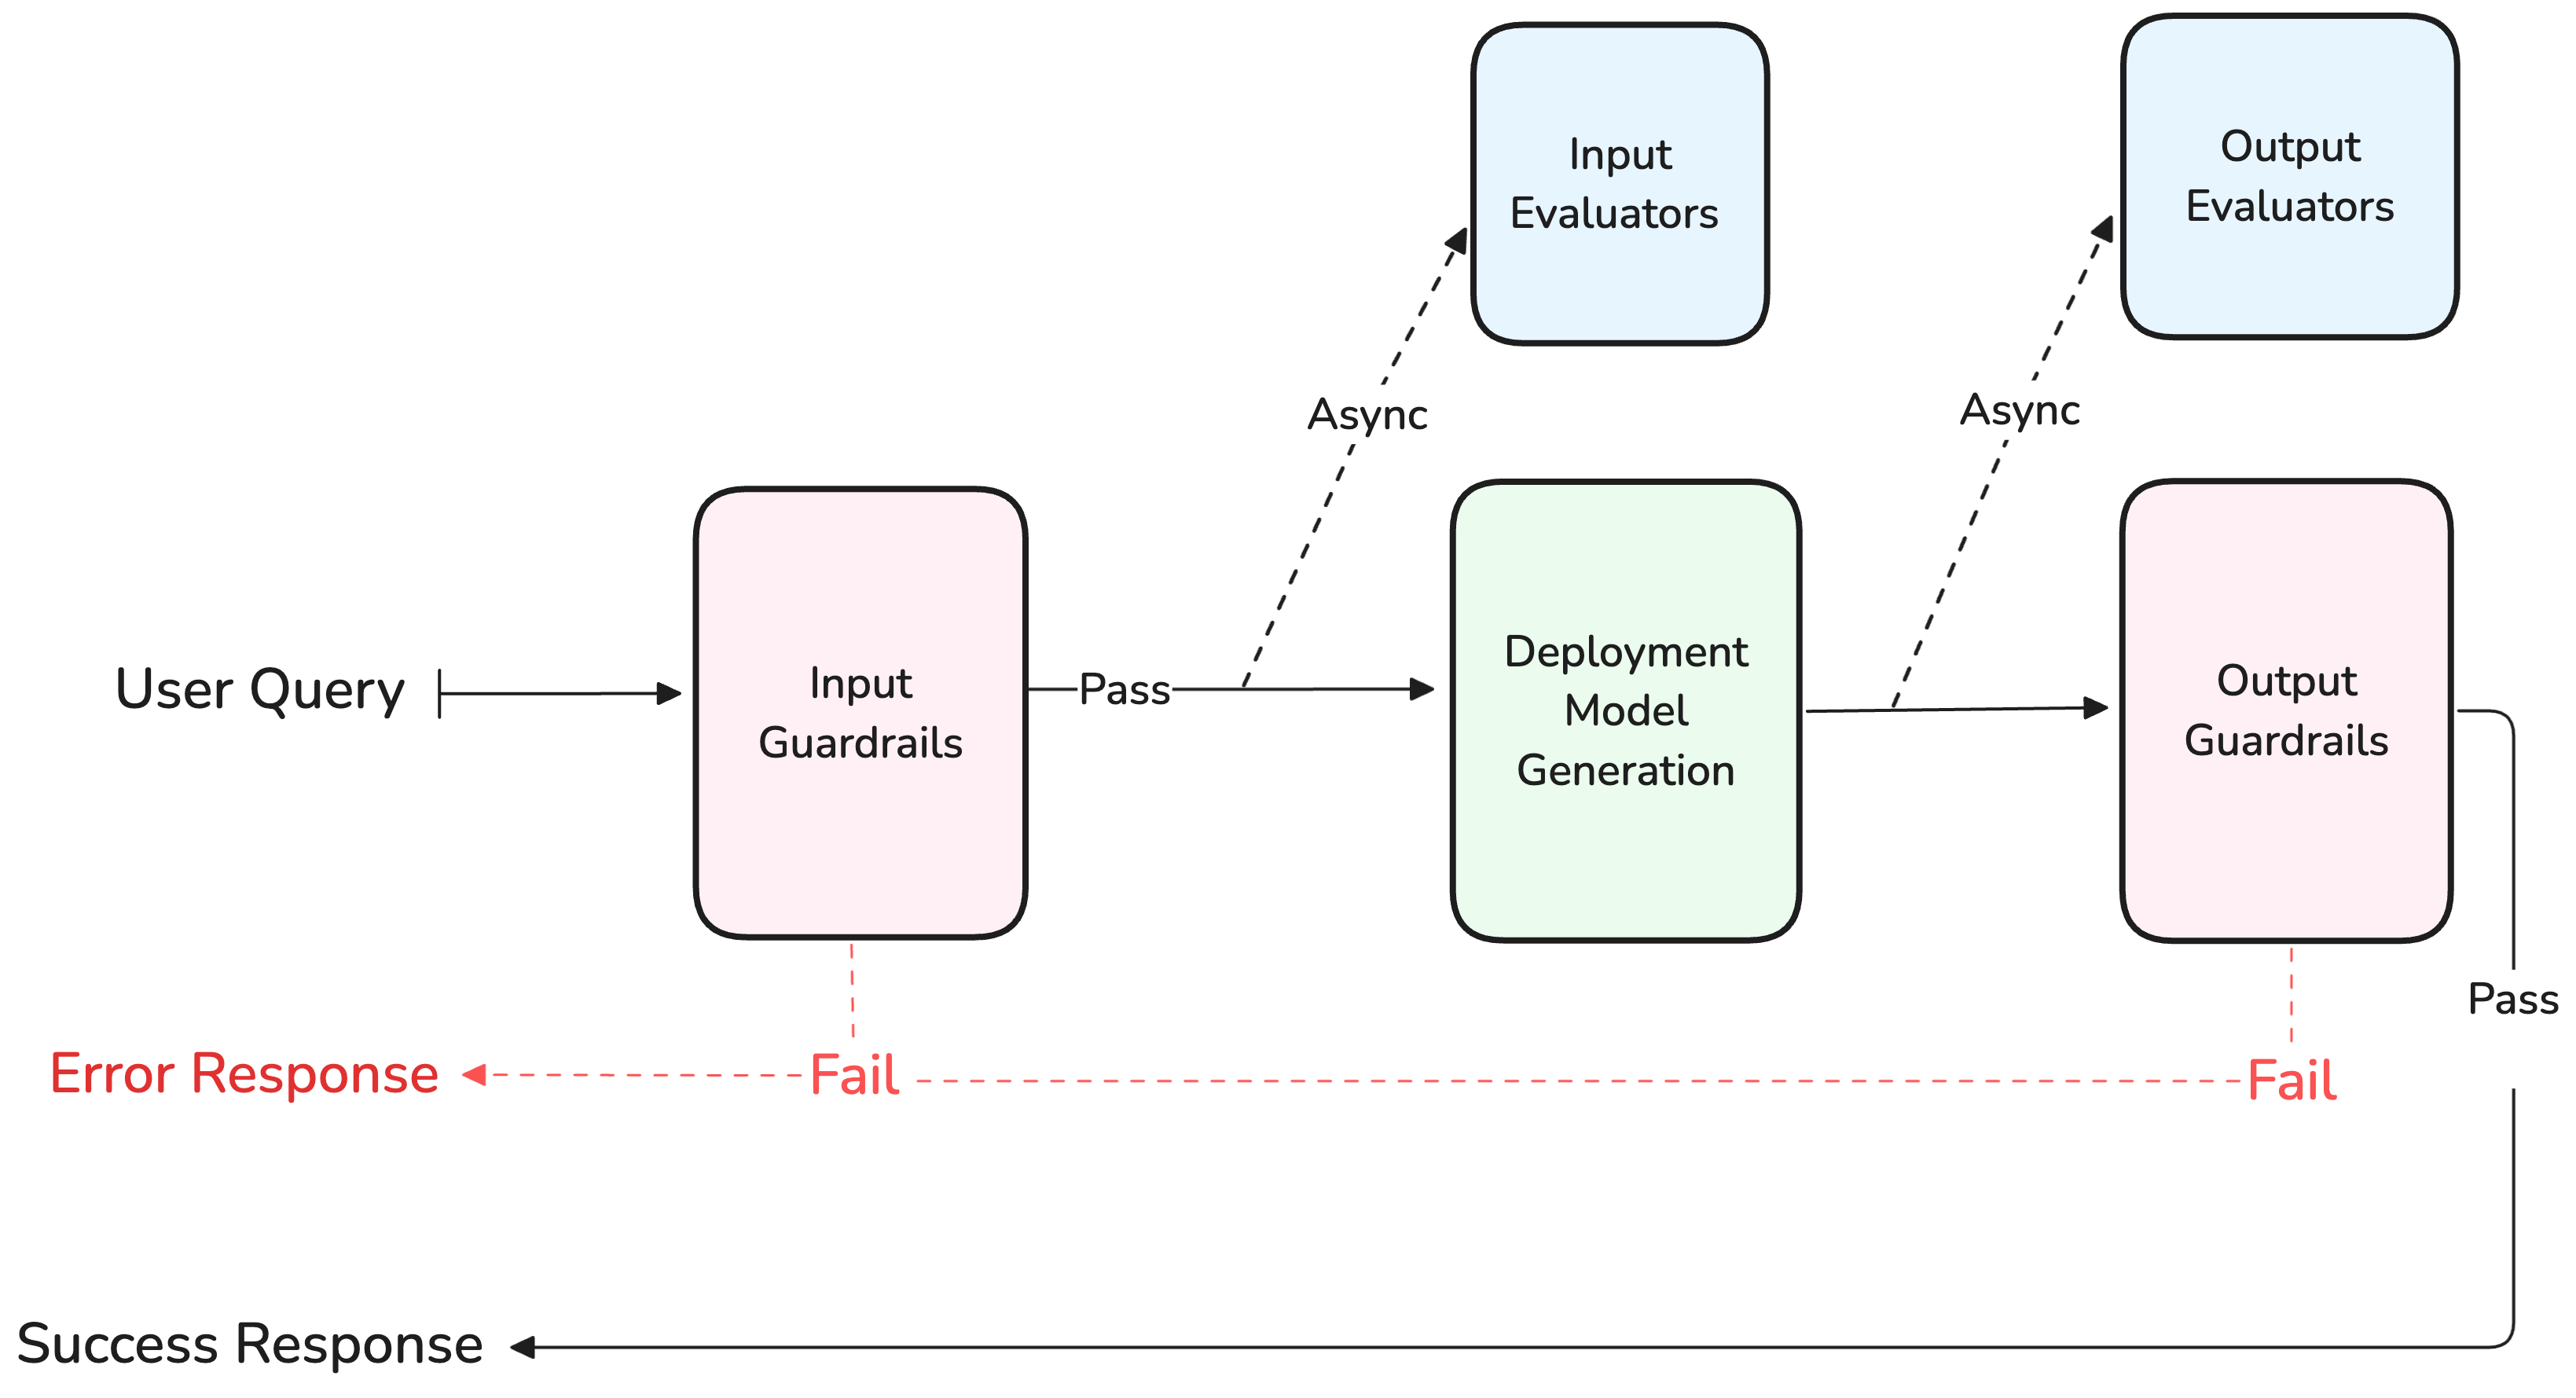
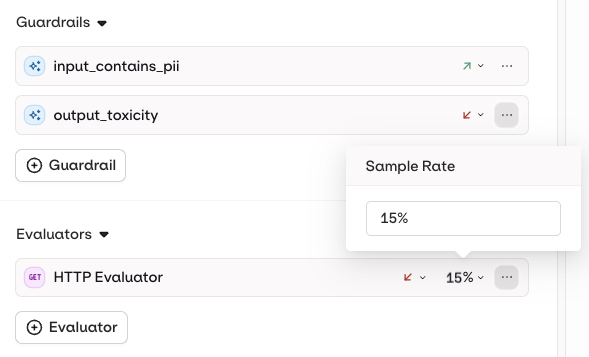
Guardrail behavior is configured per Deployment and applies to all guardrails attached to it.
- Input evaluator: runs evaluation on the input sent to the model.
- Output evaluator: runs evaluation on the output generated by the model.
Evaluators do not run when using the Test panel in AI Studio. To trigger evaluators, invoke the Deployment externally via the API or SDK.
- Input Guardrail: runs before the input is sent to the model.
- Output Guardrail: runs after generation, before client response.
| Behavior | Description |
|---|---|
| Retry | Triggers a new generation attempt. Use this when a transient or non-deterministic failure may resolve on retry. |
| Fallback | Executes the fallback model configured on the Deployment. Use this for a safe default response instead of retrying. |
See guardrails put to the test against adversarial inputs. Read our cookbook Red Teaming.
Security and Privacy
- AI Studio
Input MaskingInputs in a Variant can be flagged as PII (Personally Identifiable Information). This is recommended when processing sensitive user data such as names, email addresses, or phone numbers.To configure this, open the Security tab when editing an input and choose Personally Identifiable Information (PII) from the Privacy drop-down.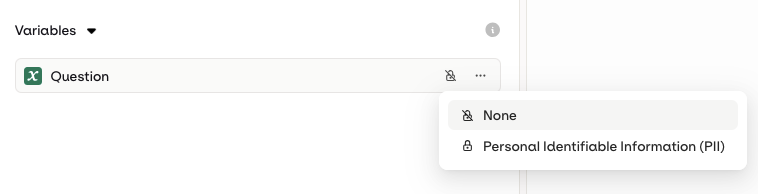
![Trace detail for gpt-4o showing a user message say hello to {name} and the assistant reply Hello, [name]! How are you today?](https://mintcdn.com/orqai/E8L3R46ivX7g9-QI/images/docs/955b175e6f005d7f112a98e54d3468acb0b72f001a150ced0ac4262128321179-iScreen_Shoter_-_Google_Chrome_-_250317122231.jpg?fit=max&auto=format&n=E8L3R46ivX7g9-QI&q=85&s=700d1089a333f51107572e98bb4a0a05)
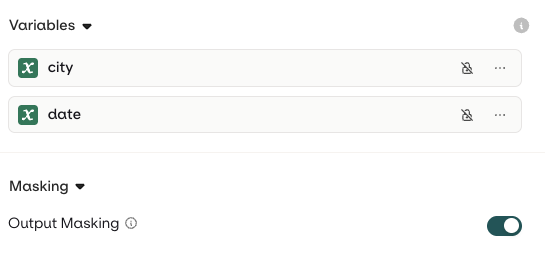

The API response will include the PII, but input and output logs and traces will not be logged in Orq.ai.
Add a Variant
- AI Studio
A single Deployment can hold multiple Variants. Multiple Variants can handle different use cases and scenarios within one Deployment, and can be served simultaneously through Routing.To add a new Variant, select the Variant name at the top-left of the screen and choose Add variant.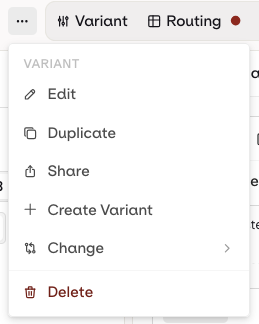
Routing
- AI Studio
Once a Variant is ready to be deployed, configure the routing variables to control which Variant is reached. Open the Routing page by selecting Routing at the top-left of the panel.The Routing panel maps Variants to Context field values: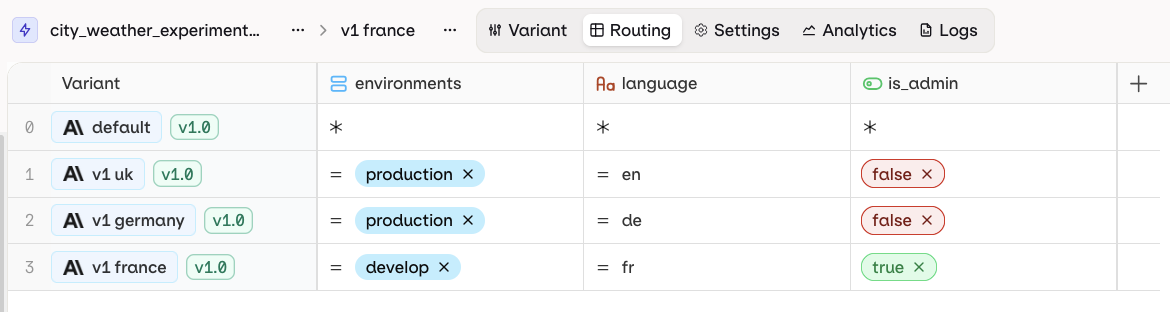
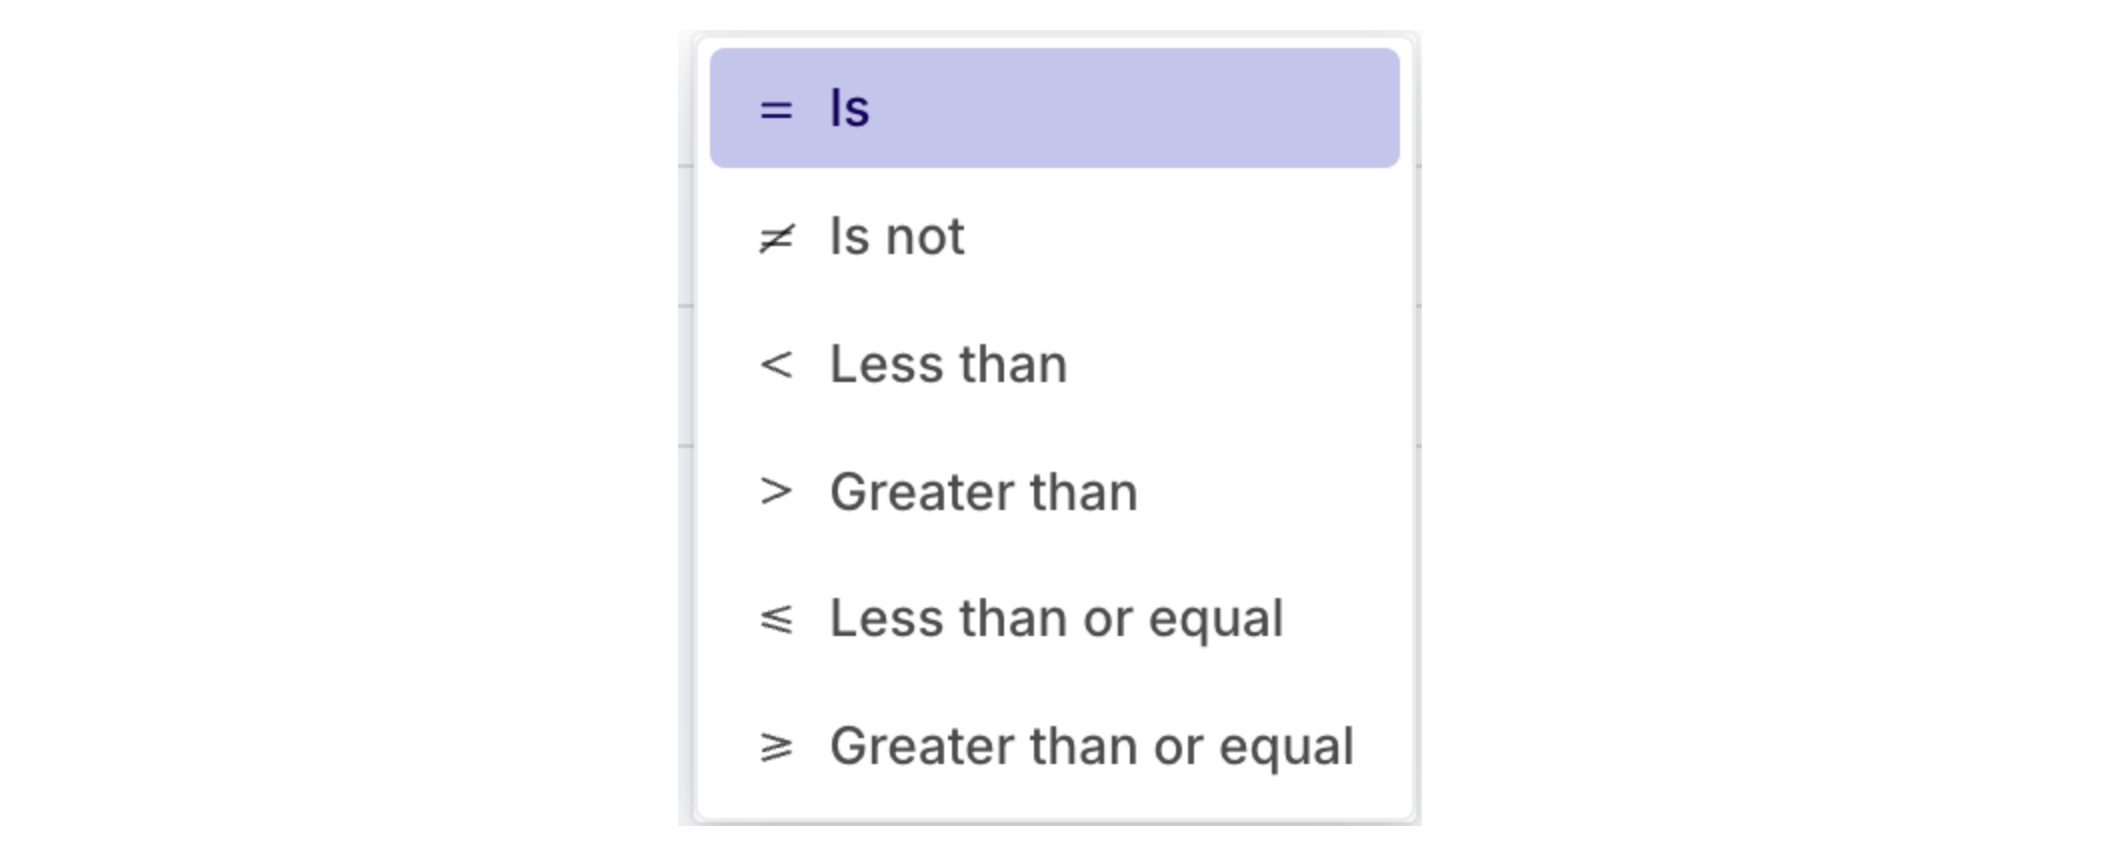
Each row represents a single Variant. Each column represents a single Context field. Each cell represents a Value for a Context field to be matched with a Variant.
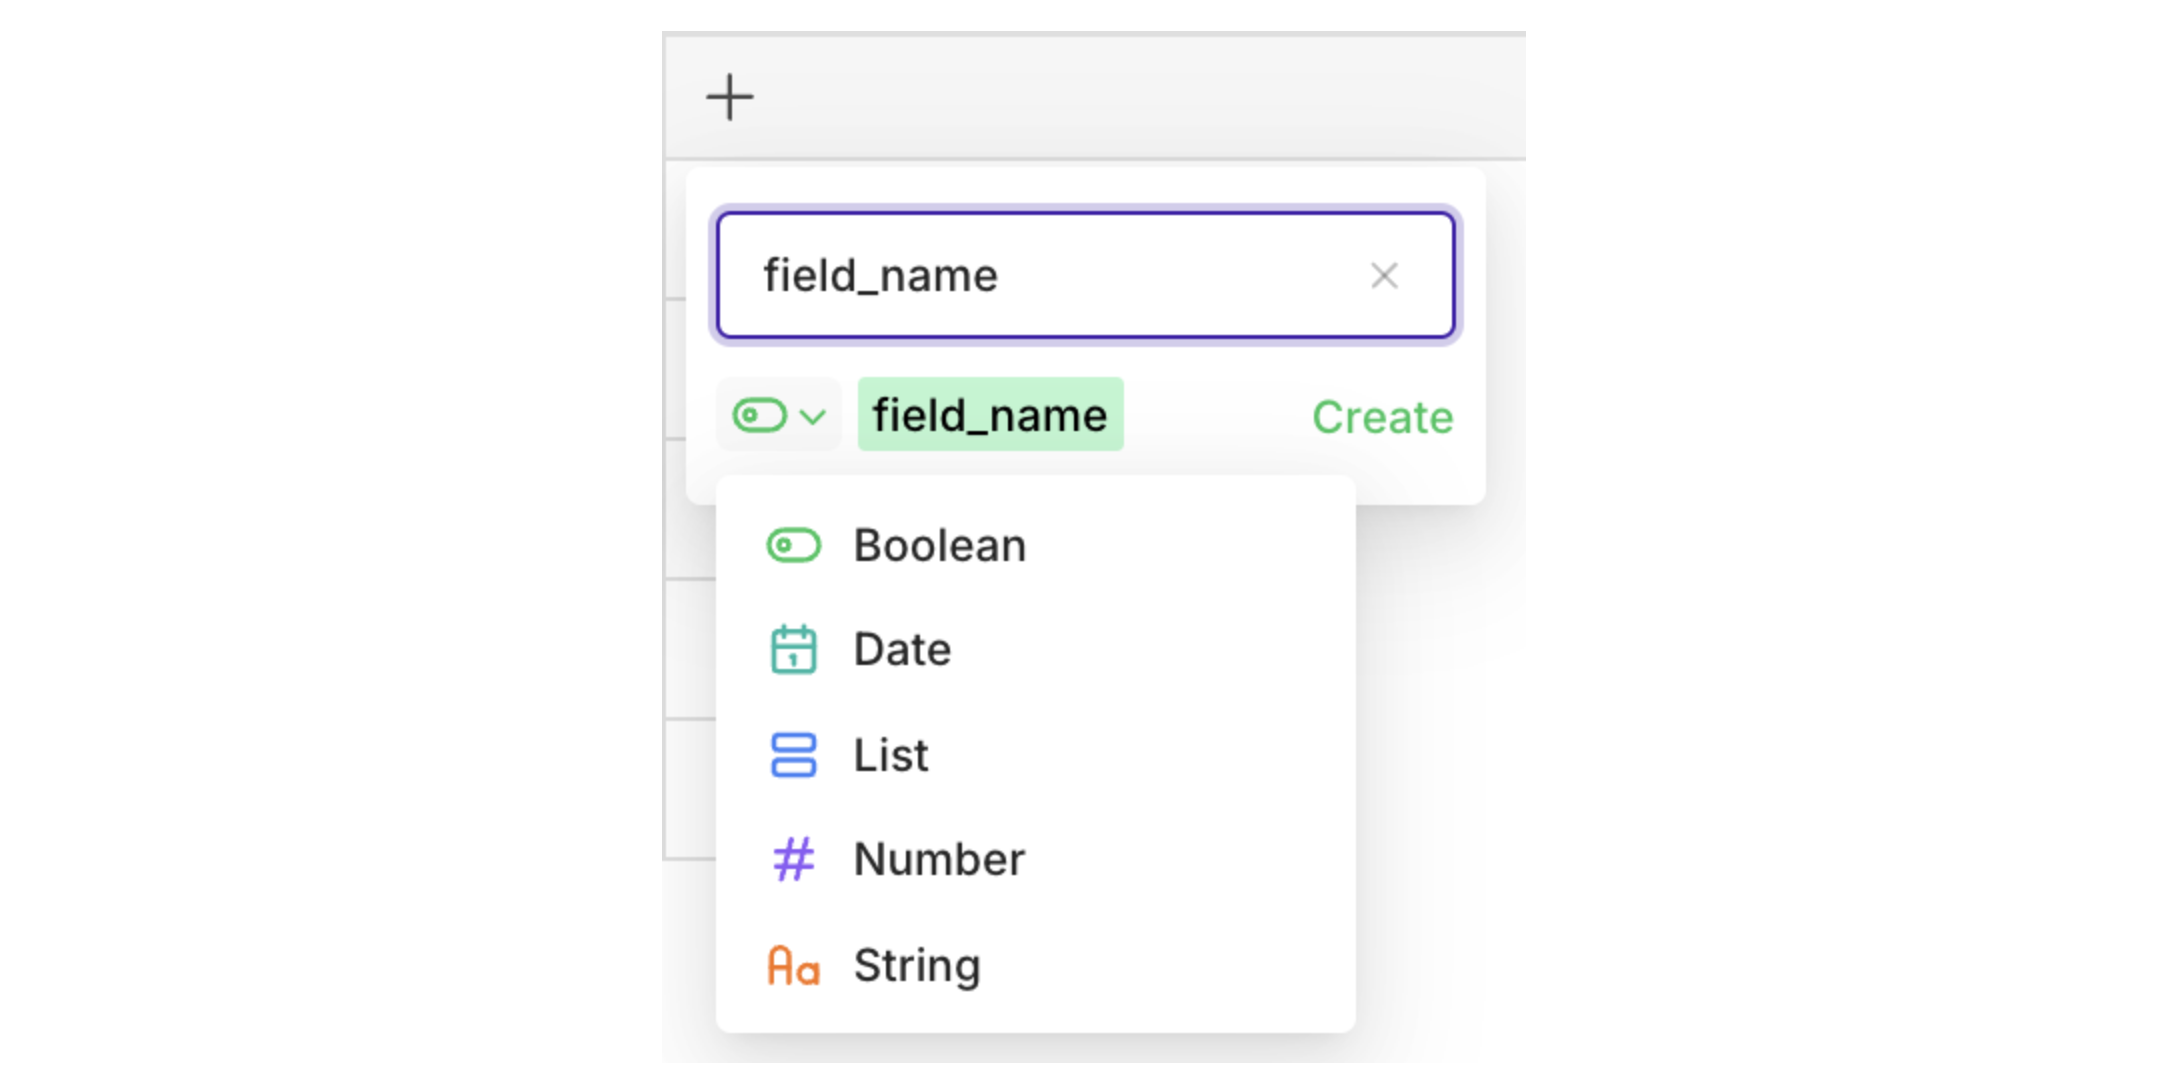
boolean, date, list, number, or string.= operator is used. Click = to change the operator.Versioning
- AI Studio
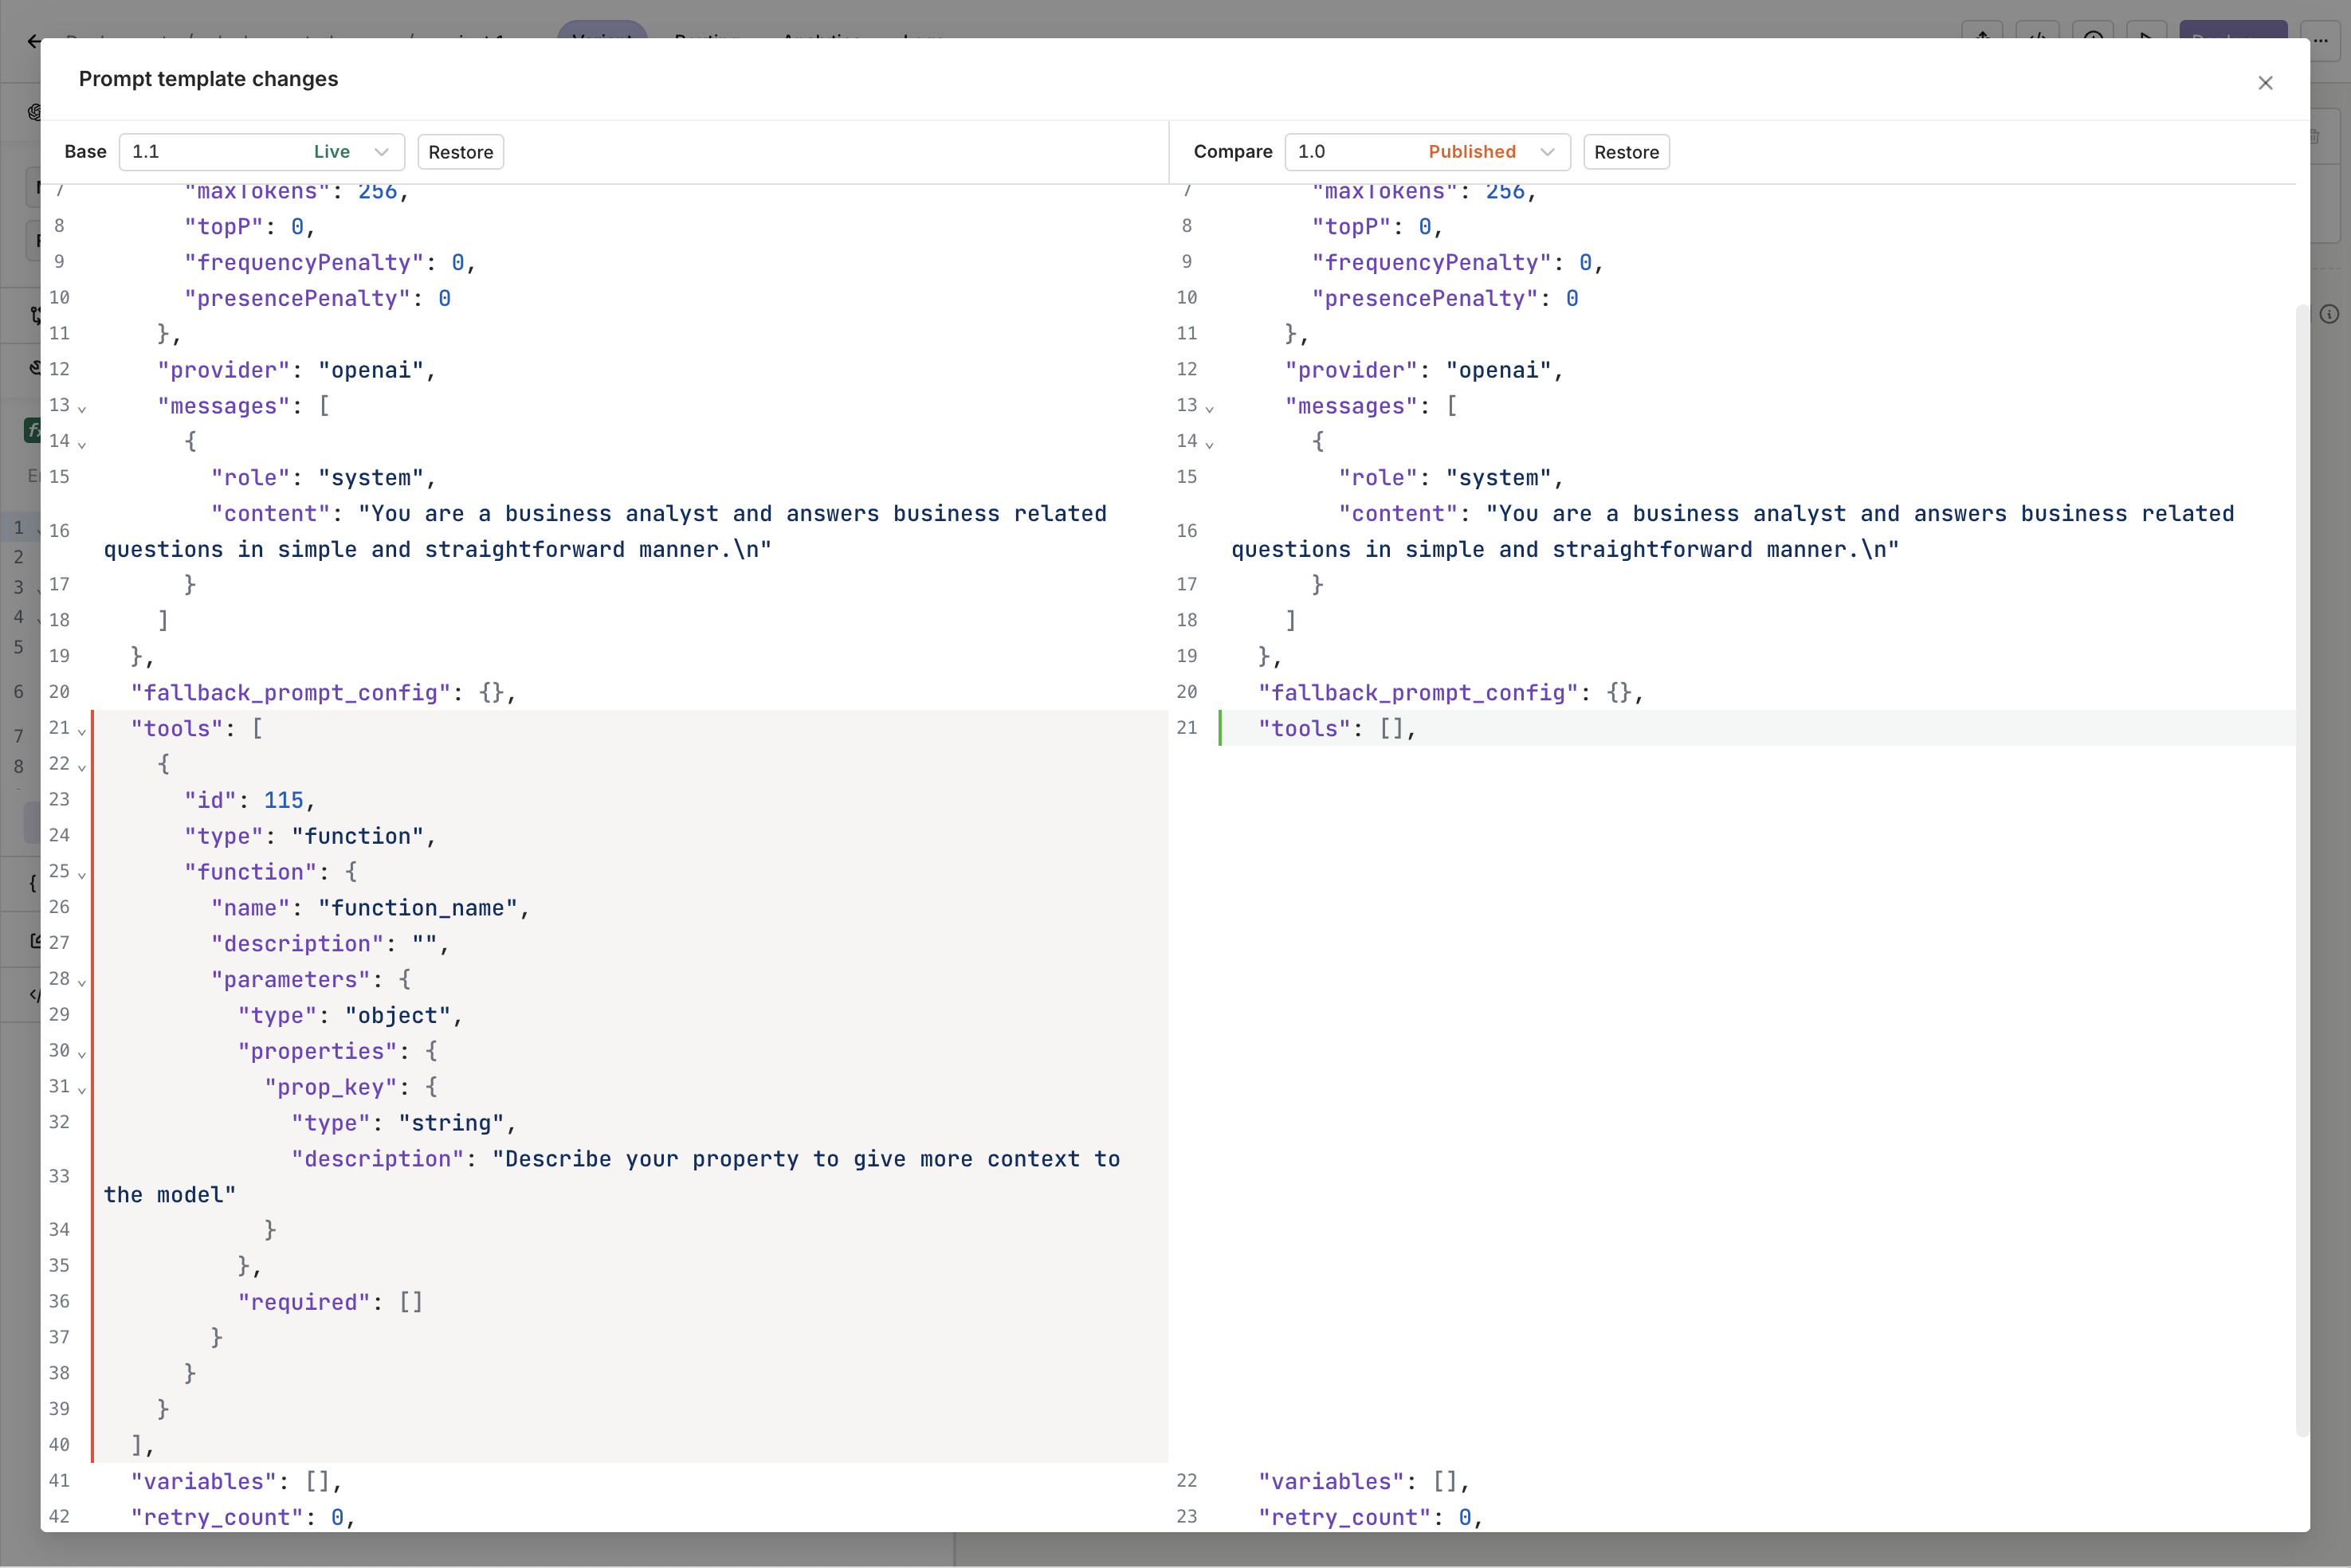
Version control tracks all changes to the model and prompt configuration. A new commit is made on each deployment and history is preserved throughout. All changes can be viewed, and any prior version can be restored.Deploying a New VersionWhen the configuration is ready, press the Deploy button on the Variant screen.
Test a Deployment
- AI Studio
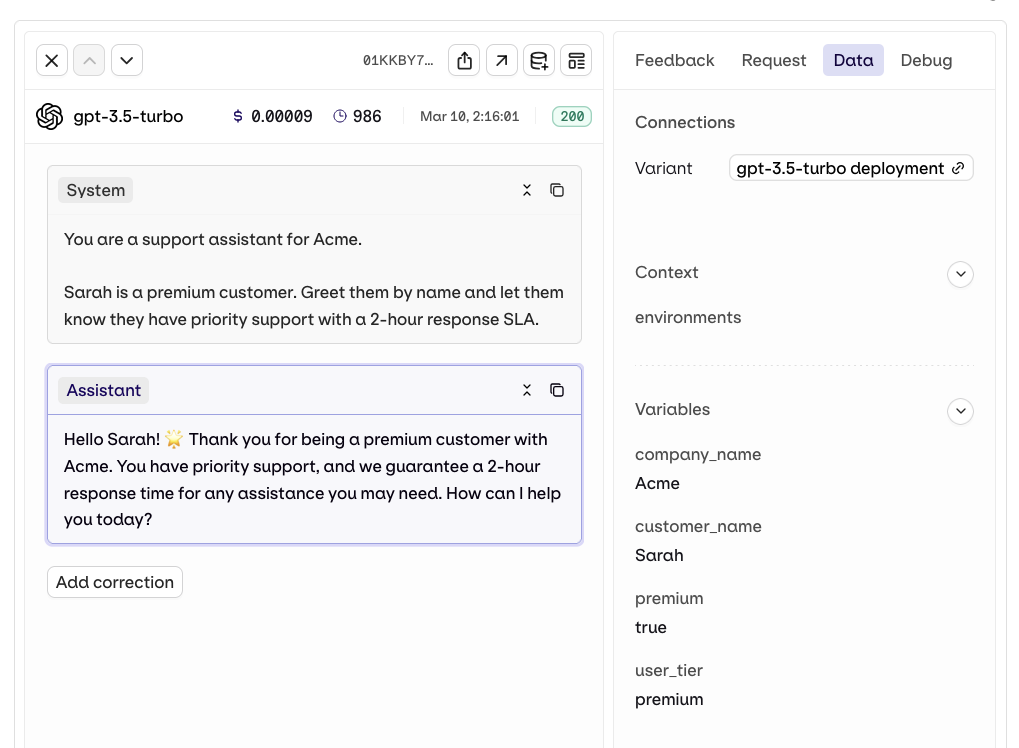
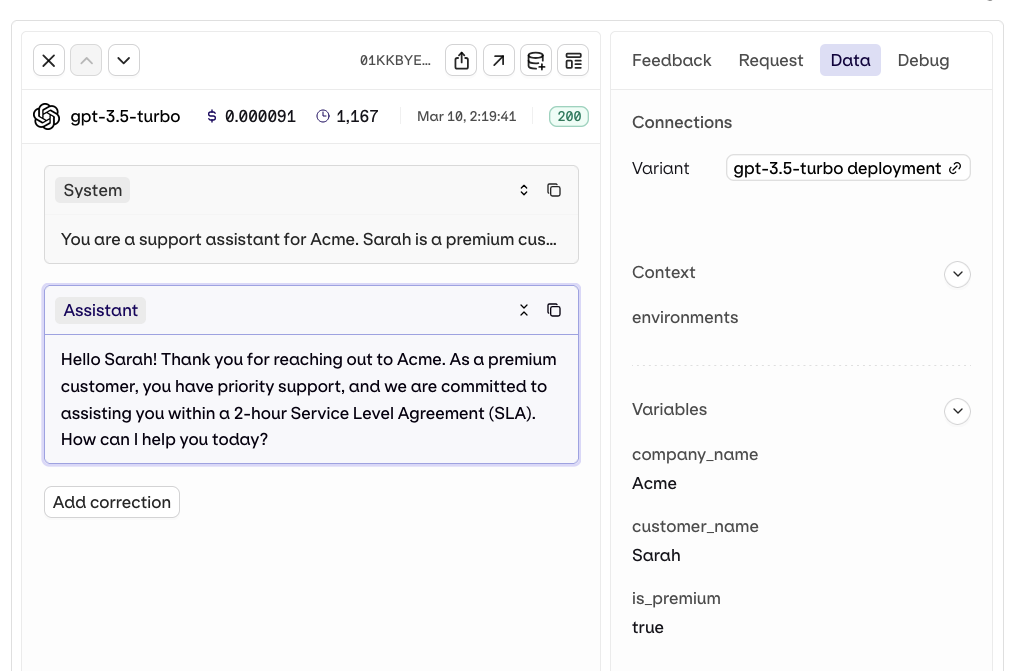
Click Test in the Deployment toolbar to open the Test panel. Enter values for any configured variables and submit to see the model response inline. No code required.This is useful for quickly checking prompt content and model behavior during development.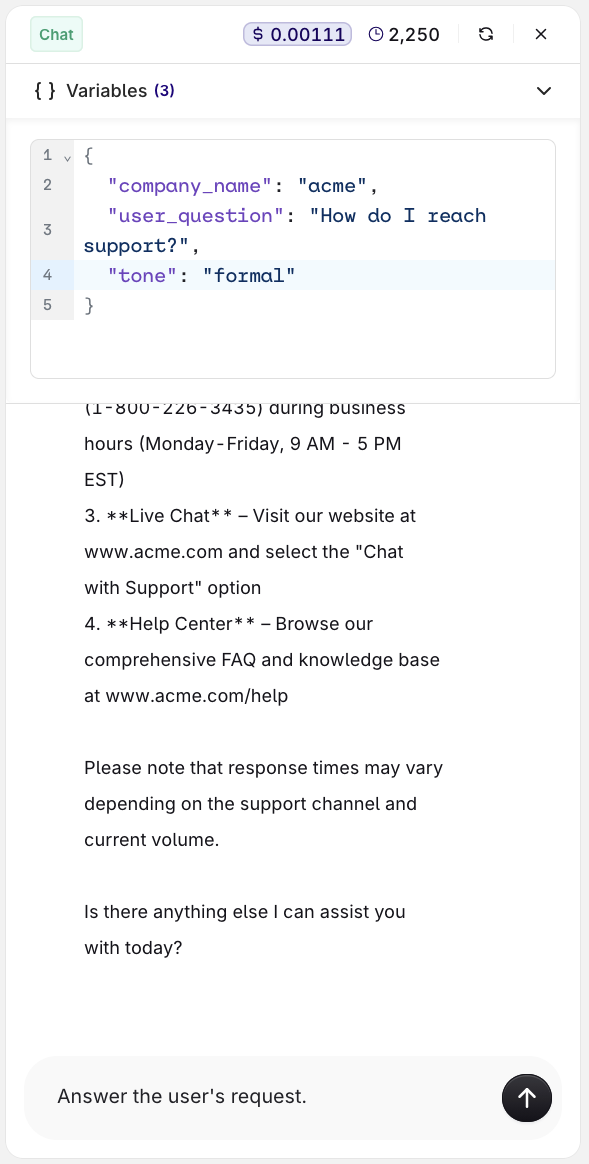
Invoke a Deployment
- AI Studio
- API & SDK
Use the Code Snippet button at the top-right of the Variant page to get ready-to-use integration code for Python, Node.js, and cURL. All snippets include the keys and context variables needed to reach the current Variant.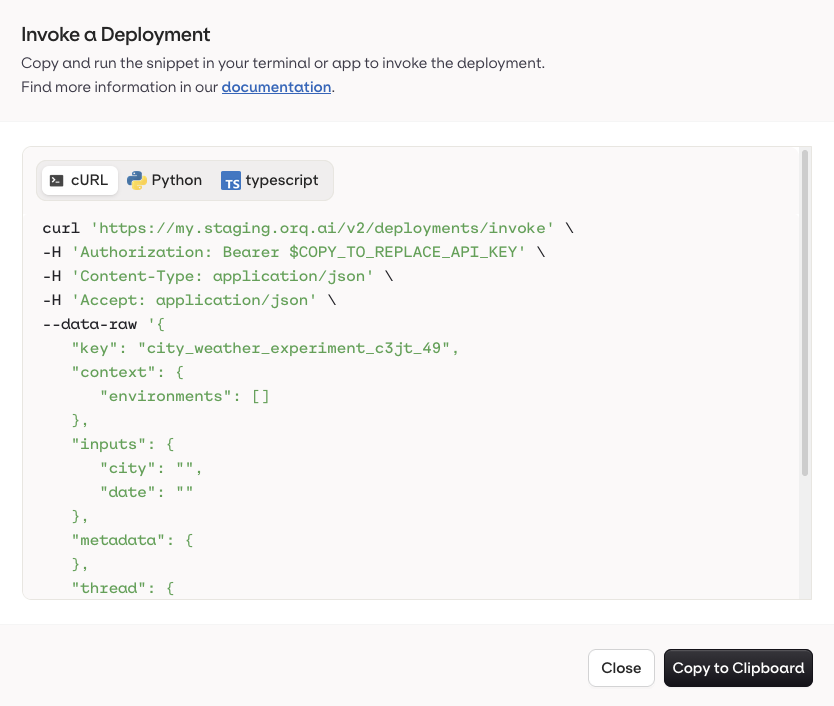
-
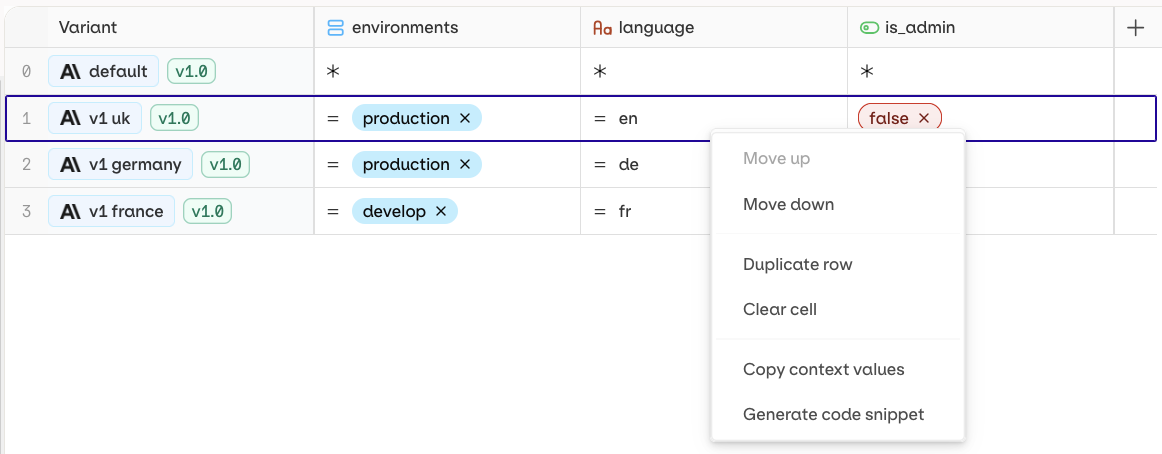
Open a Deployment and go to the Routing page.

- Right-click the target Variant and select Generate Code Snippet.
Extra Parameters
- API & SDK
Use Overwriting an existing parameter at runtime:
extra_params to pass parameters not directly exposed by the Orq.ai panel, or to override existing model configuration at runtime.Passing an unsupported parameter:Attach Files
- API & SDK
The
file_ids / fileIds parameter on deployment invocations is deprecated and will be removed in a future release. Use native file attachment instead.- Send PDFs directly to the model in the invocation payload.
- Attach a Knowledge Base to the Deployment.
file type message with a standard data URI scheme: data:content/type;base64 followed by the base64-encoded file data.See PDF inputs used to extract structured data end-to-end. Read our cookbook PDF Extraction.
Read how to set up a Knowledge Base or use a Knowledge Base in a prompt.
Analytics and Logs
- AI Studio
Once a Deployment is running and receiving traffic, detailed analytics of all requests are available.Logs show requests per Variant. Filters available: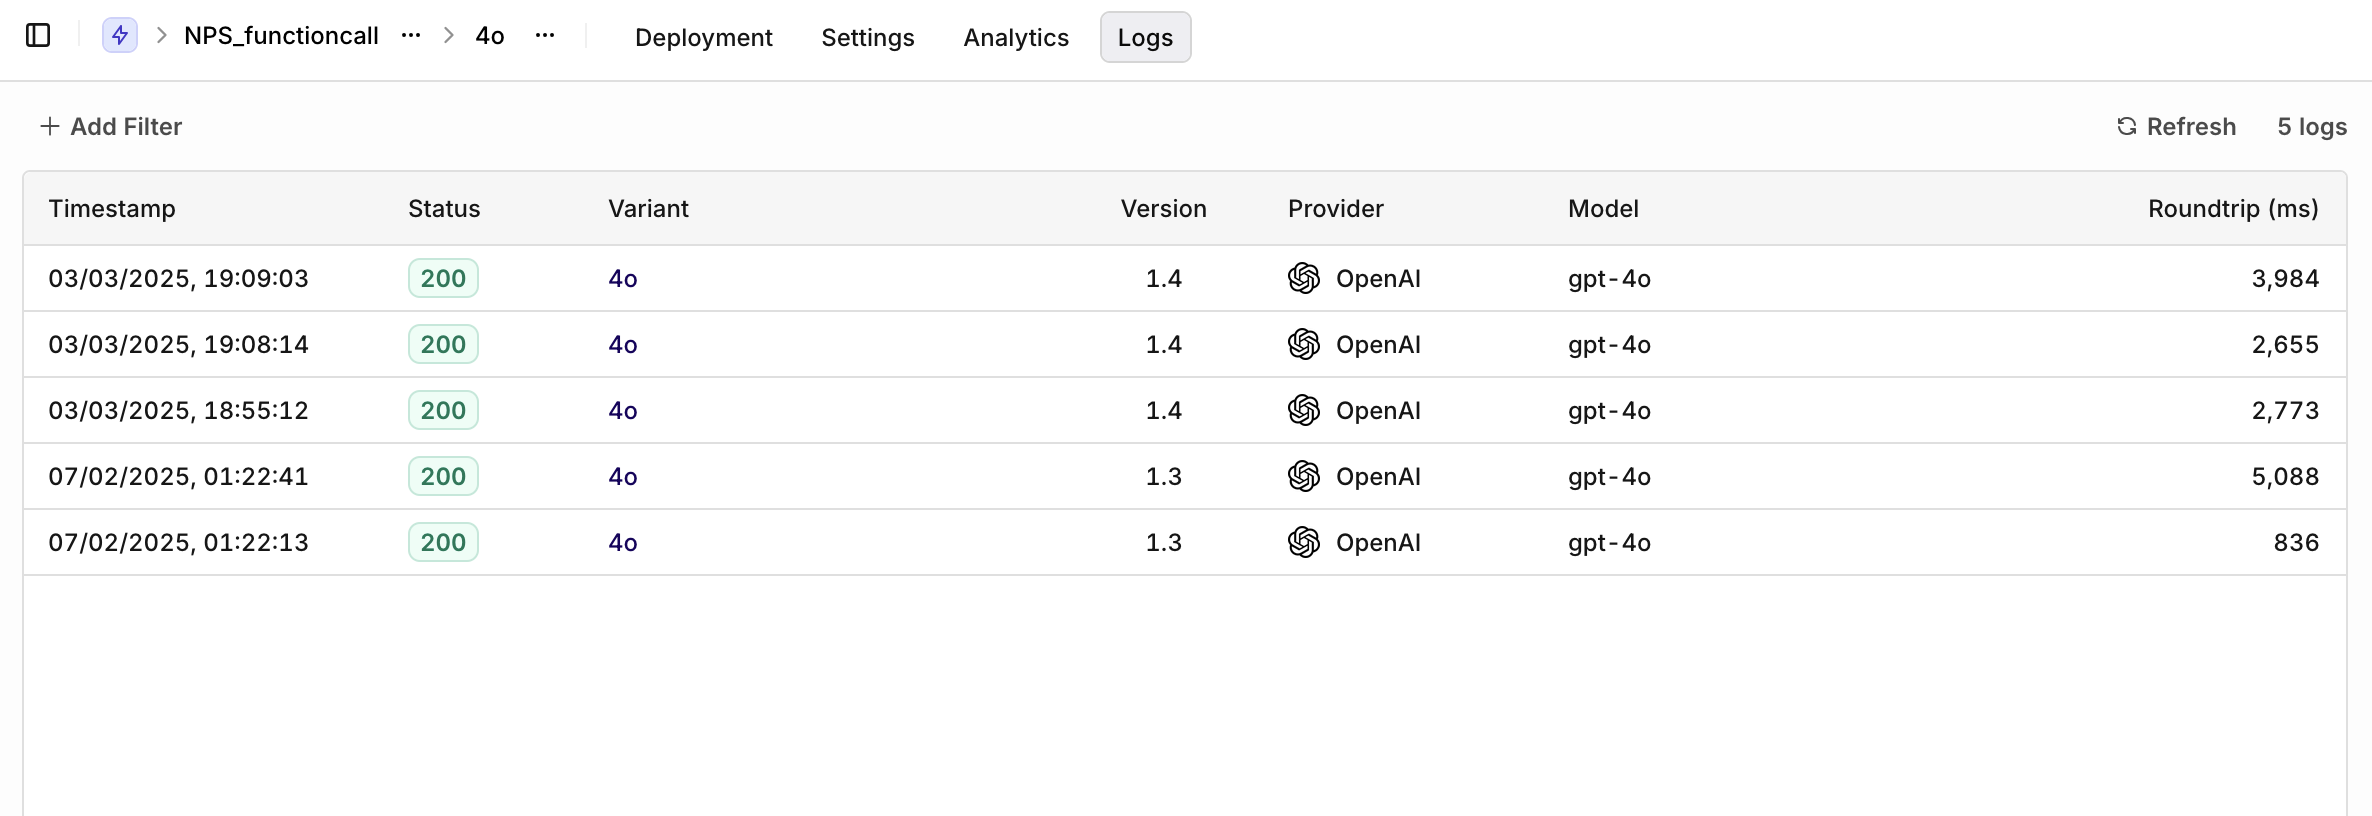
- Variant: select a single Variant to filter logs.
- Evaluation: Matched (a routing rule was matched) or Default Matched (no routing rule matched, default Variant was used).
- Source: API, SDK, or Simulator.