Setting up an Experiment
Follow these steps to set up your first Experiment
Overview
The Experiments module enables efficient testing of multiple scenarios across different prompts, models, and evaluators simultaneously.
- Each Run executes model generations using configured Inputs and Messages from a Dataset.
- After a Run completes, Latency and Cost metrics are recorded for each generation.
- Results can be reviewed manually or validated automatically with Evaluators, allowing for comparison across an Expected Output.
Prerequisites
Before creating an Experiment, you need a Dataset. This dataset contains the Inputs, Messages, and Expected Outputs used for running an Experiment.
- Inputs – Variables that can be used in the prompt message, e.g., {{firstname}}.
- Messages – The prompt template, structured with system, user, and assistant roles.
- Expected Outputs – Reference responses that evaluators use to compare against newly generated outputs.
To get experiments ready, make sure you have models available by adding them to your Model Garden.
Note: You don’t need to include all three entities when uploading a dataset. Depending on your experiment, you can choose to include only inputs, messages, or expected outputs as needed. For example, you can create a dataset with just inputs.
Creating an Experiment
To create an Experiment, head to your Orq.ai Panel:
- Choose a Project and Folder and select the
+button. - Choose Experiments
Afterwards, select a Dataset to use as a base for your Experiment and choose one or multiple models.
You'll be then taken to the Report view where you can configure Dataset entries and models before running the experiment.
Configuring Experiment
Data Entry Configuration
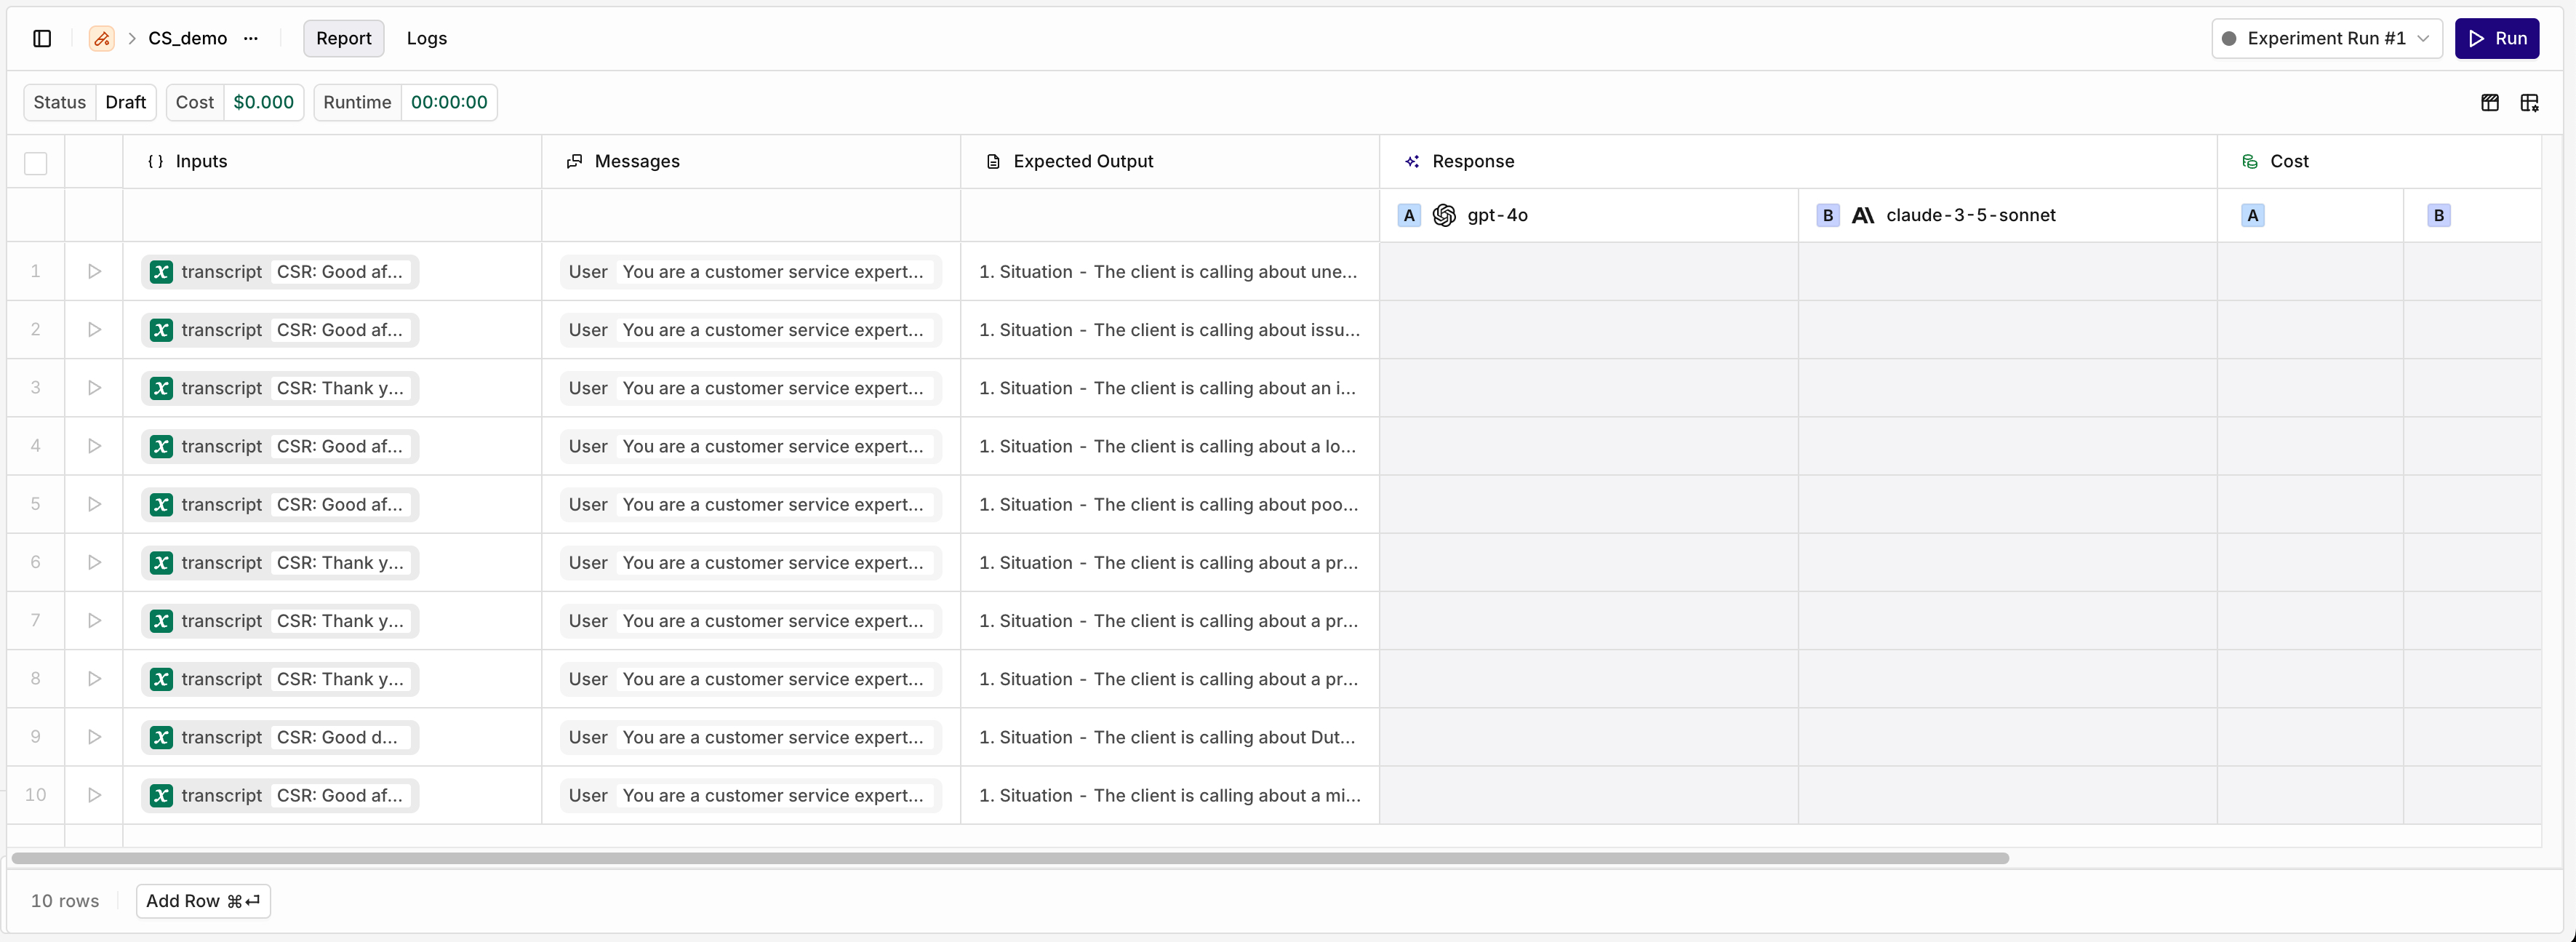
The left side of the table shows the loaded Dataset entries. Each entry is shown as a row and will be executed separately with each configured prompt.
You can add new entries to be tested during experiment by using the Add Row button.
Each entry's Inputs, Messages and Expected Outputs can be edited independently by selecting a cell.
Prompt Configuration
Your chosen prompts are displayed as separate column within the Response section.
Prompts are assigned a corresponding letter (see Aand B above) to identify their performance and Evaluators results.
To add a new prompt, head to the right of the table, select Add a Column and choose Prompt.
Select the Prompt Name to open the Prompt panel and Configure the Prompt Template.
There are 2 ways to configure your prompt: Using the 'messages' field in the dataset or by using the prompt column
To learn more about Prompt Template Configuration, see Configuring a Prompt in Experiments
Configuring Evaluators
You can choose to add Evaluators to automatically validate and compare outputs.
To add a new Evaluator, head to the right of the table, select Add a Column and choose Evaluator.
To learn more about Evaluators in Experiments, see Evaluators in Experiments
Running the Experiment
Once configured, you can run the Experiment using the Run button.
Depending on the Dataset size it may take a few minutes to run all model prompts generations.
Once successful your Experiment Run Status will change to Completed. You can then see Experiment Results.
To run another iteration of the Experiment, with different prompts or data, use the New Run button. A new Experiment Run will be created in Draft state.
Seeing Experiment Results
Report
Once an Experiment is ran, its status will change from Running to Completed

The total cost and runtime for the Experiment will be displayed.
The right side of the table will be filled with results.
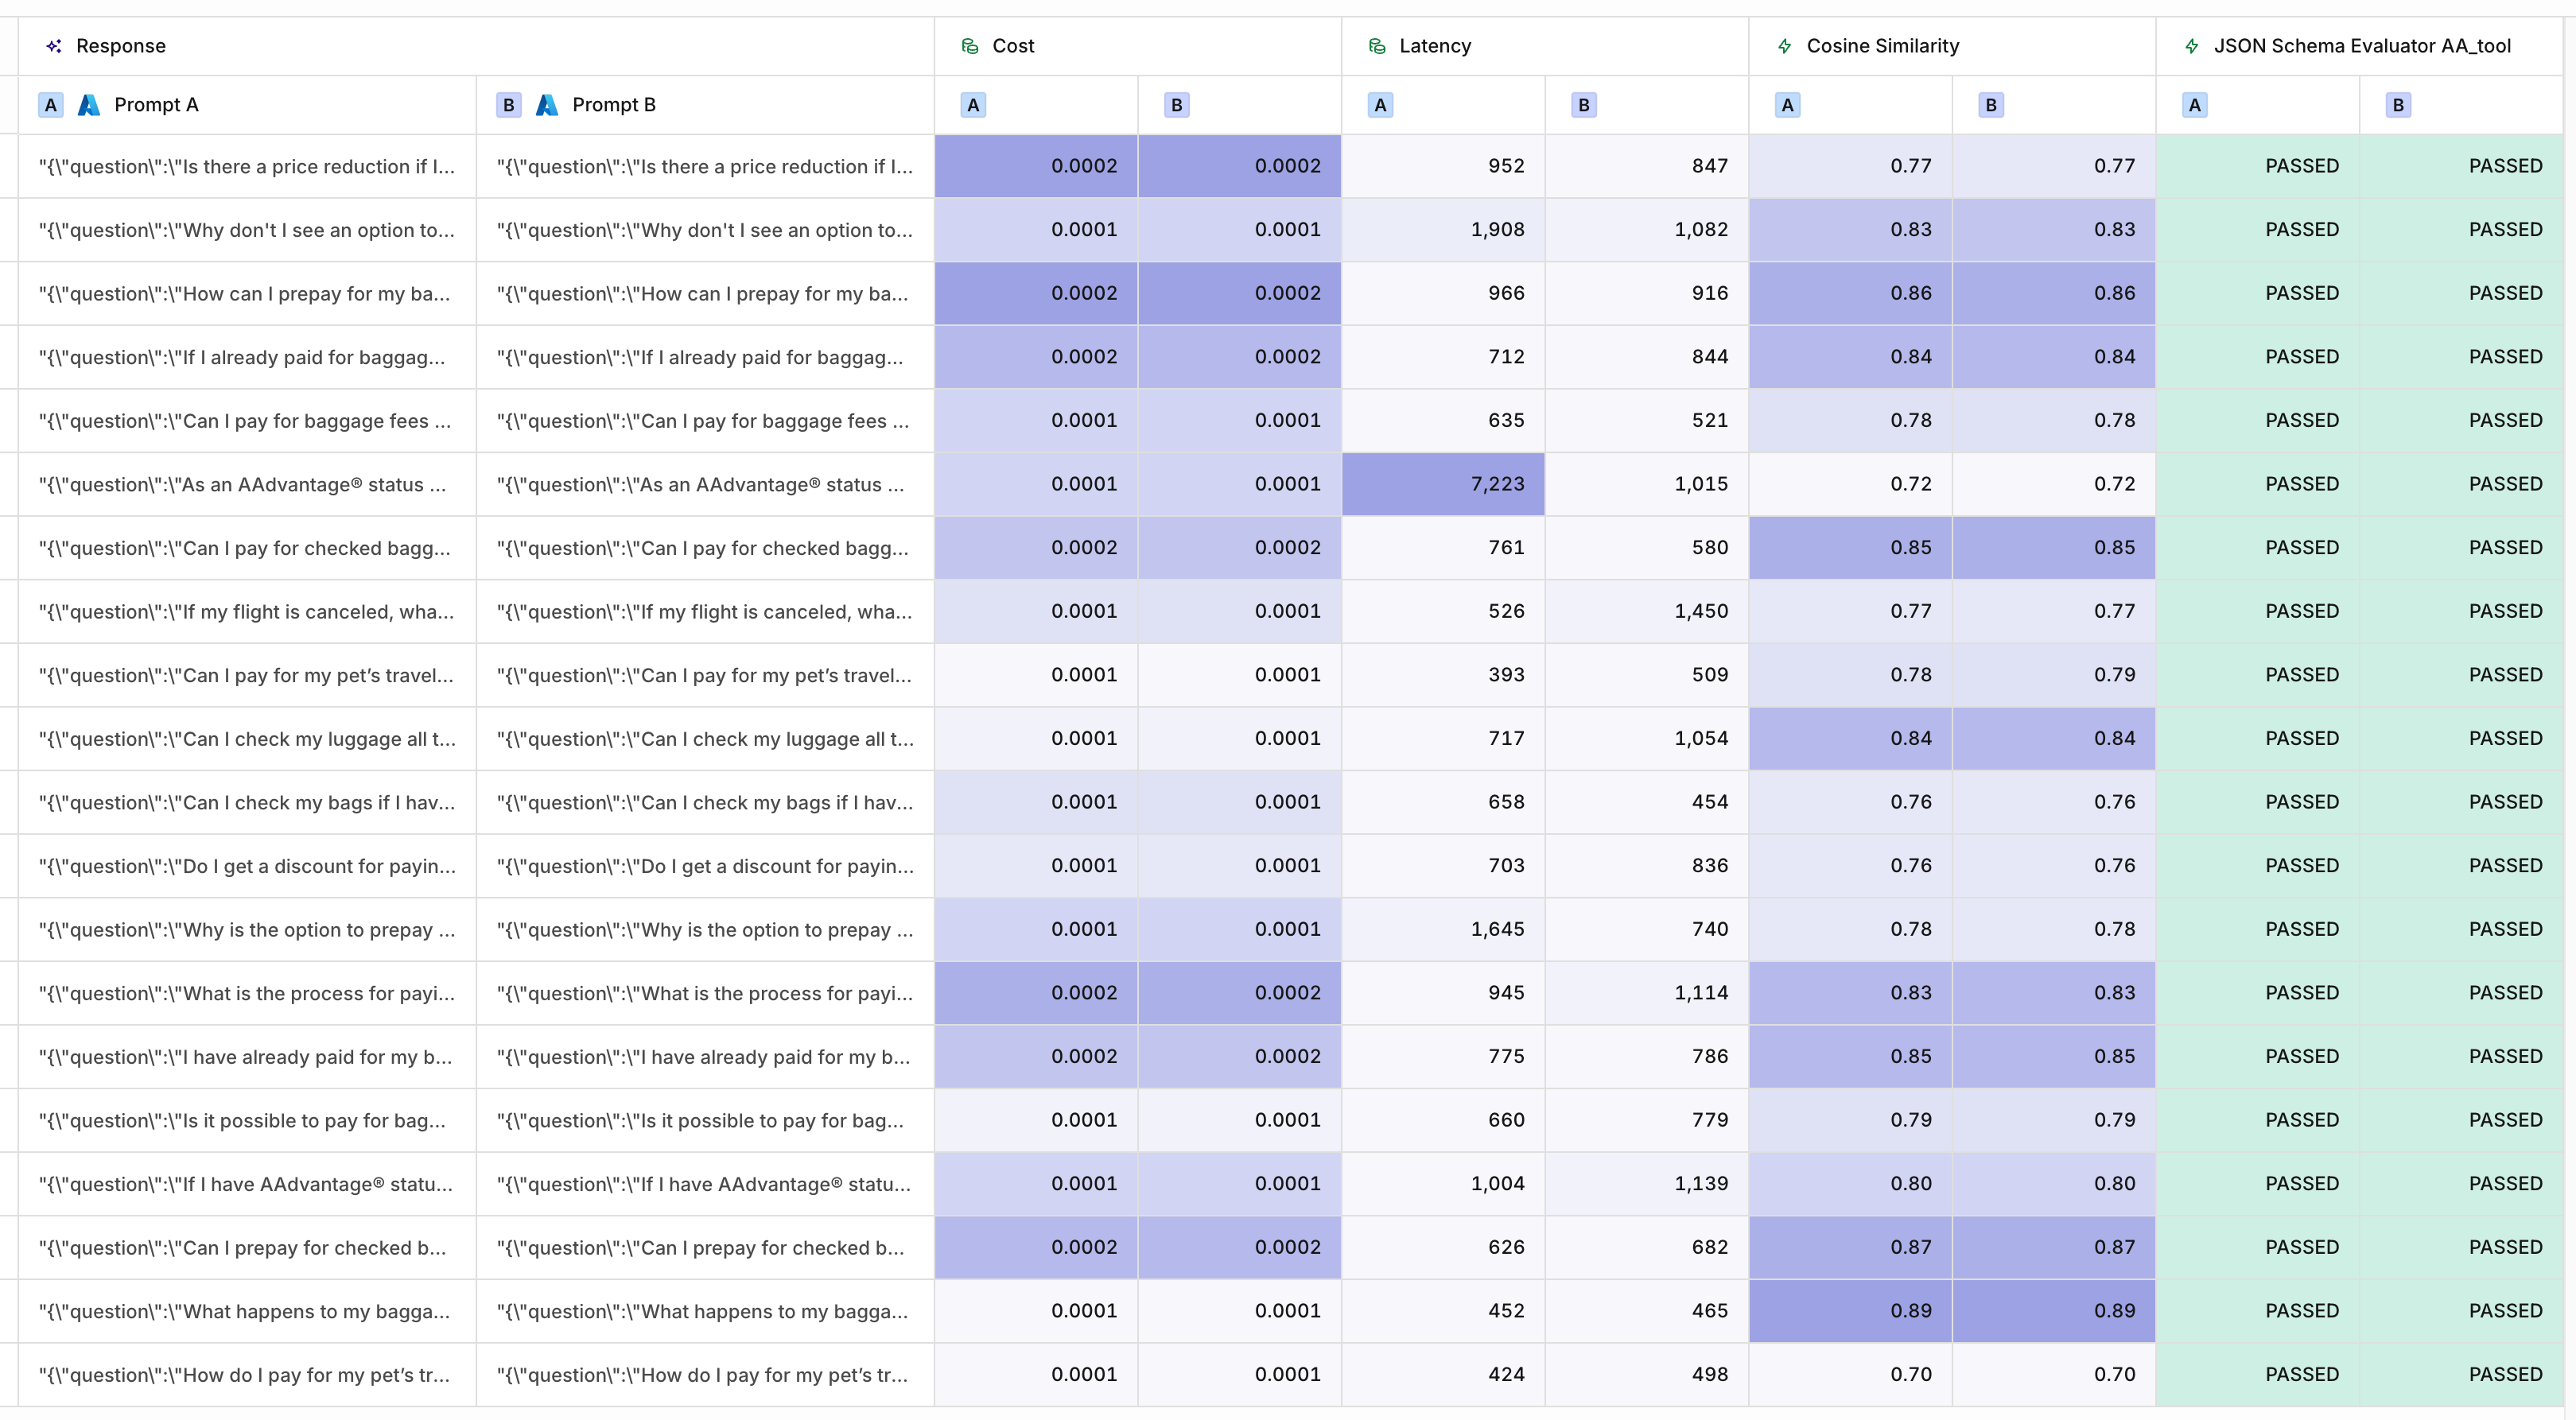
The results for Prompts A and B
Under each Column corresponding to each Prompt you can see results for:
- Latency.
- Costs.
- Evaluators.
Logs
Switching to the Logs tab lets you see the details of each call.
Within logs you can process Feedback and build Curated datasets.
By hovering a cell you can also directly access the related log using the See log button.
For easy comparison between models and prompts, you can also click the Show Comparison button. This will open the panel below which allows you to quickly compare the output side by side and navigate through the different rows.
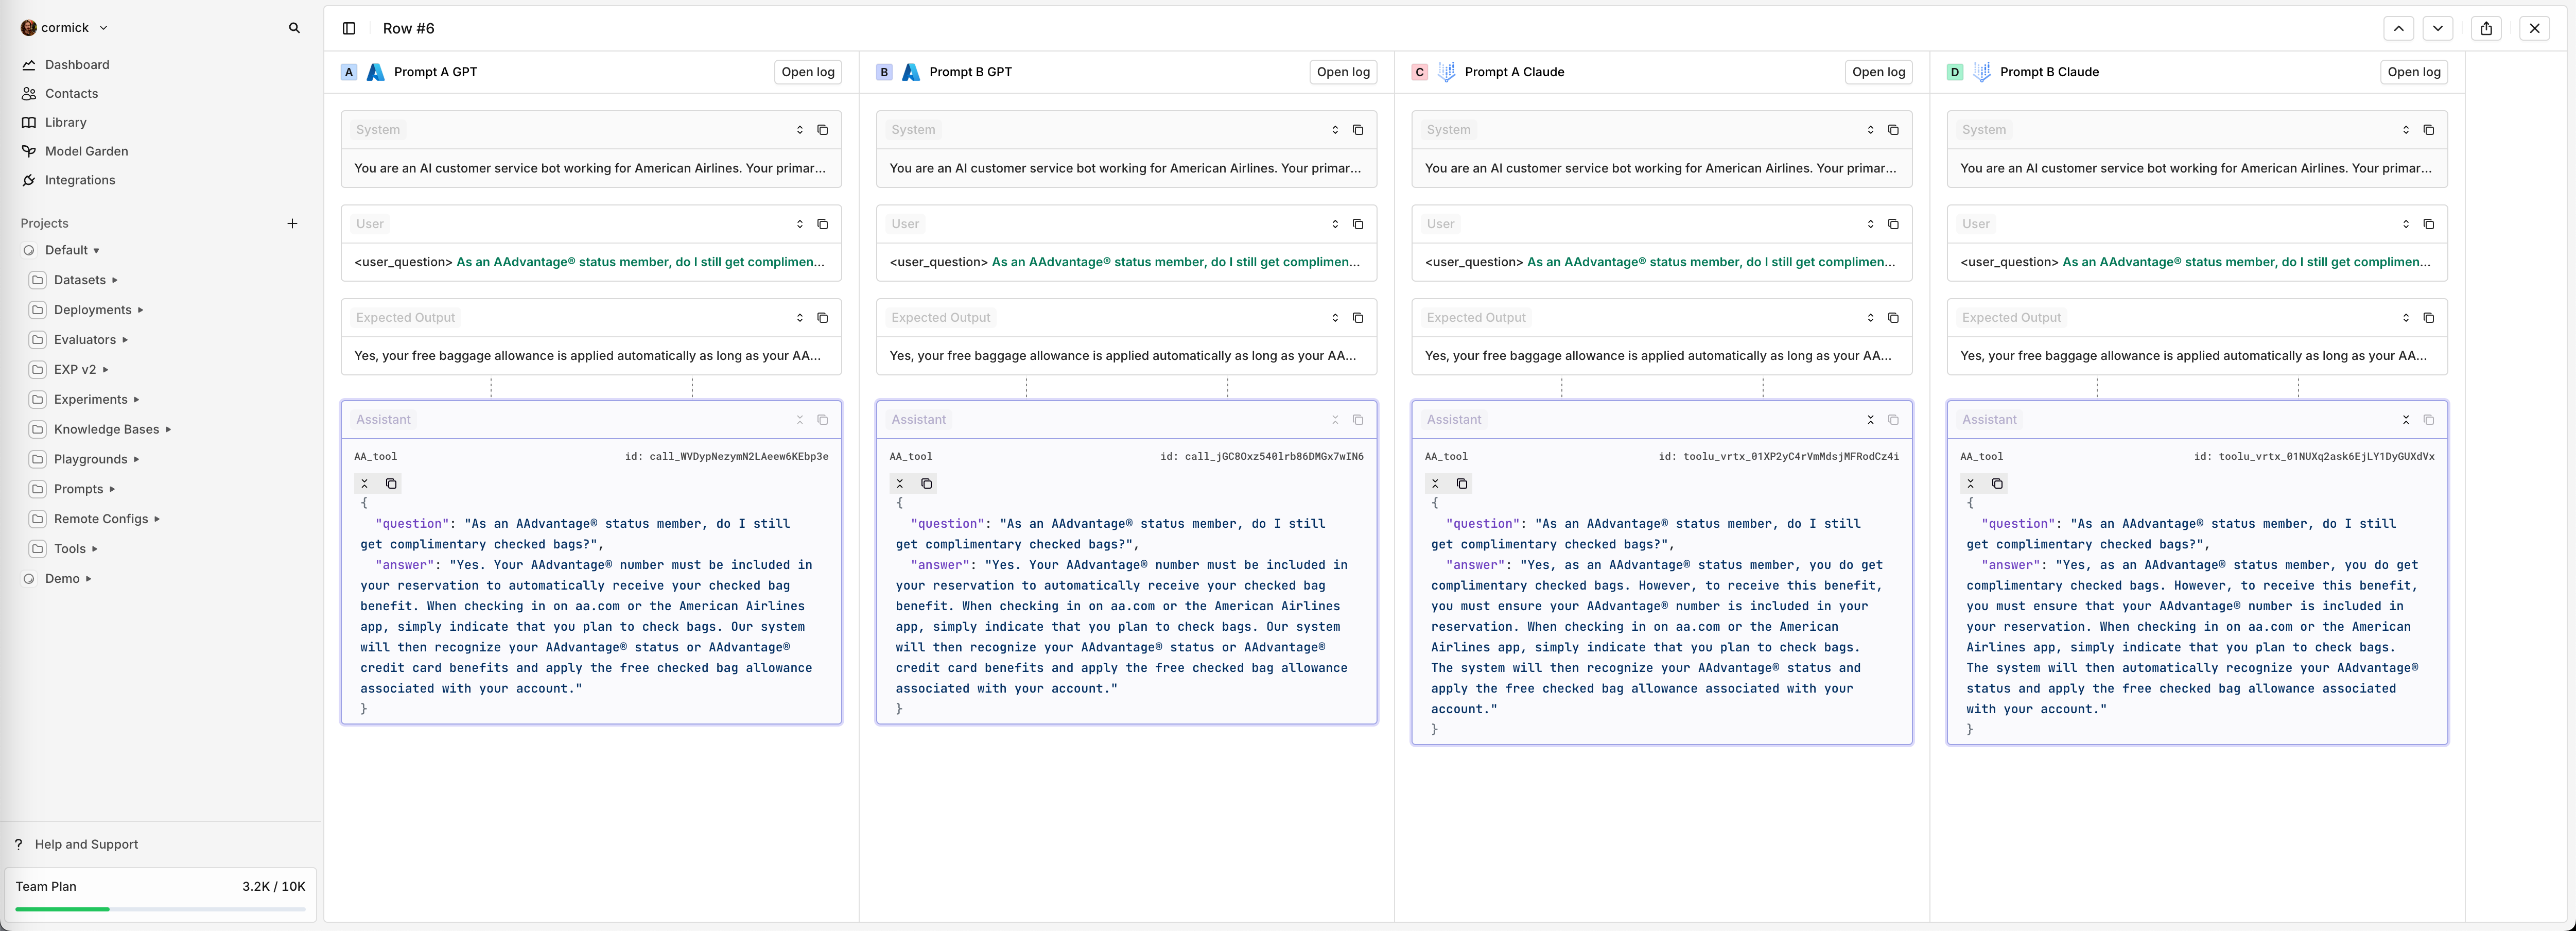
Comparing Prompt version A and B from GPT-4o and Claude 3.5 Sonnet
Export
You can export datasets and results in CSV, JSON and JSONL formats using the Export button.
Updated 22 days ago