Overview
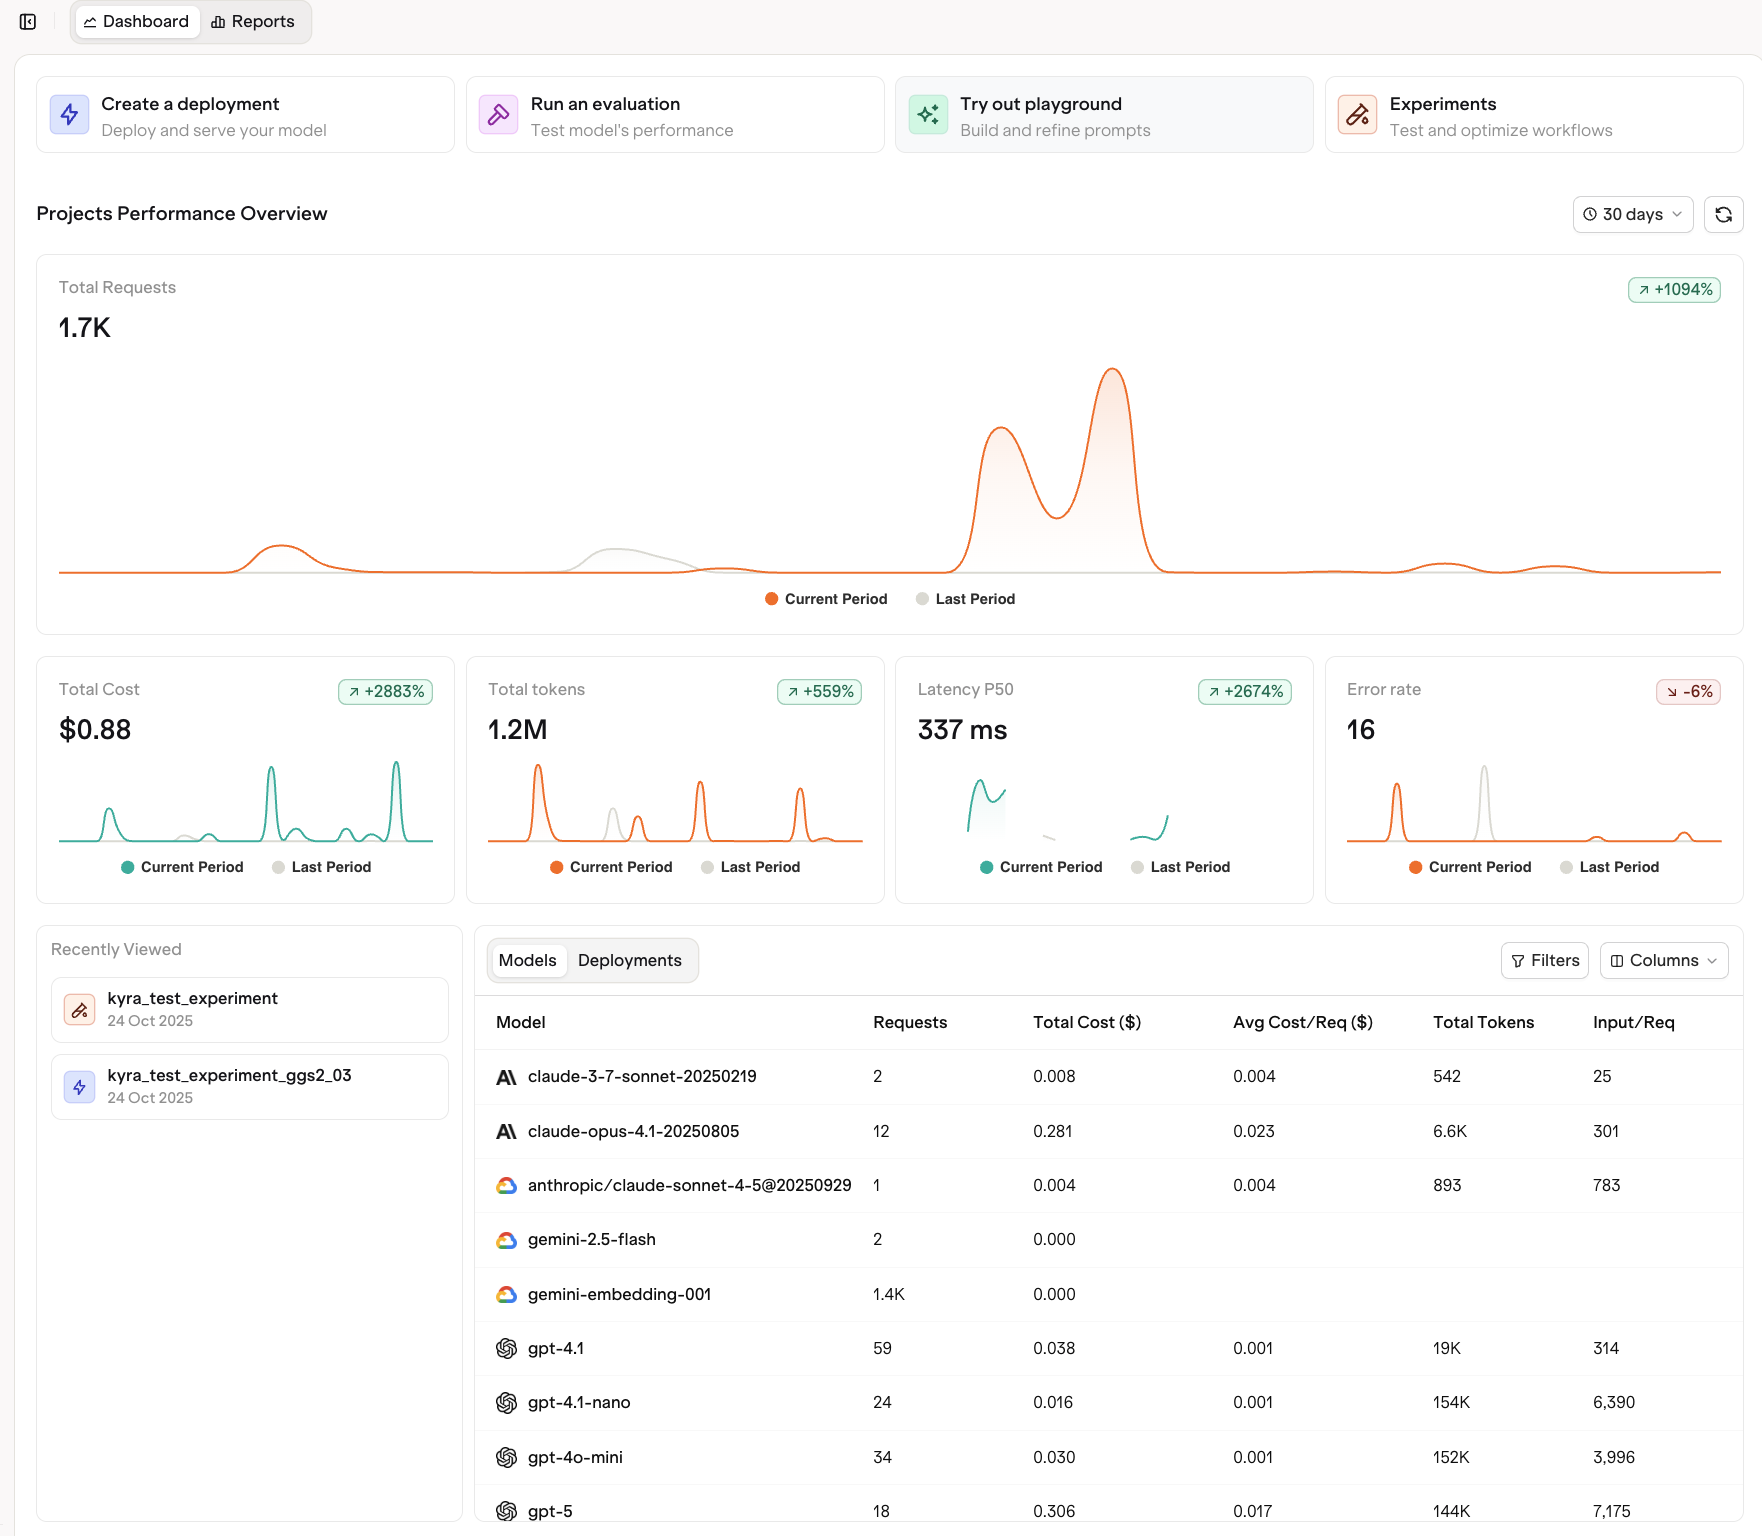
The Dashboard is divided into four main sections:- Quick Actions to instantly build a new entity
- Project Performance Overview for high level metrics and trends
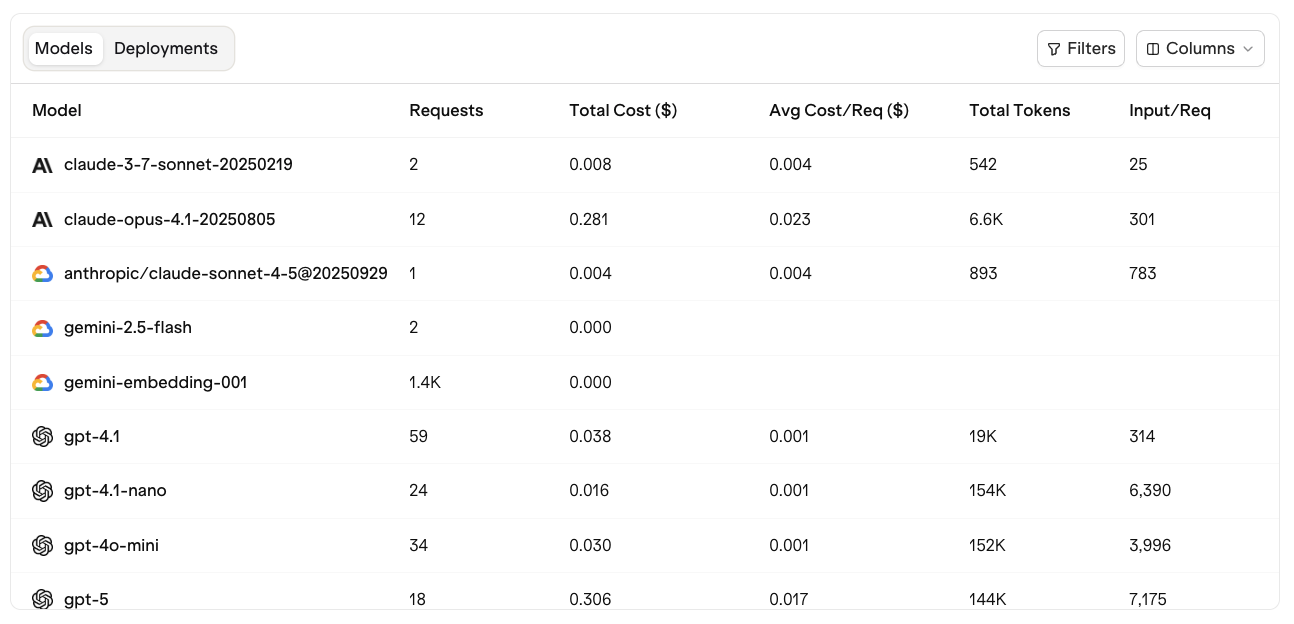
- Model and Deployment Tables for detailed cost, latency, and usage analysis
- Recently Viewed provides a shortcut to the most recent items you have interacted with to resume work seamlessly
Project Performance Overview
The performance overview provides real time insights across key metrics for your selected time period:- Total Requests
- Total Cost
- Total Tokens
- Latency (P50)
- Error Rate
Use the time range selector in the top right corner (e.g., 7 days, 30 days, custom) to adjust your view and compare performance over time.
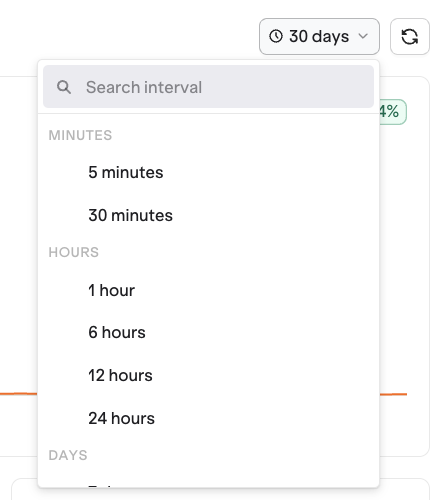
Period
You can change the visualization period by pressing the drop-down menu at the top-right of the screen.
Models & Deployments
The lower half of the Dashboard provides detailed analytics for all your models and deployments. Each table displays metrics such as:- Requests (total and per request)
- Cost (total and average)
- Tokens (input, output, and per request)
- Latency (P50)
- Error Count and Rate


